
Join us on our journey towards renewable energy excellence, where knowledge meets innovation.

The escalation of conflict in the Middle East and the subsequent blockade of the Strait of Hormuz have served as a real-time stress test for European energy markets. Synertics’ latest analysis reveals that while long-term renewable fundamentals remain stable, short-term PPA valuations are still linked to fossil fuel volatility. This occurs because gas-fired generation often sets the marginal clearing price for the power grid, meaning a spike in gas costs immediately inflates the benchmark prices used to value PPA contracts. This study of six national markets highlights how local generation mixes and grid connectivity determined the magnitude of this “Hormuz shock”.


While long-term contracts provide structural stability, short-term PPAs (1-year duration) serve as the primary tactical tool for managing immediate geopolitical risk. Because conflict-driven price spikes are often high-intensity but finite, these shorter durations allow producers and offtakers to hedge against sudden fossil fuel inflation without committing to "war-premium" pricing for a decade. This analysis focuses on 1-year PPAs to isolate how the market is pricing immediate volatility across different European borders.
Figure 1 tracks solar and wind 1-year PPA prices quoted between January 1 and April 7, 2026 (for delivery starting January 1, 2027), with a vertical reference line marking the beginning of the conflict on February 28, 2026. This baseline isolates the price movement before and after the shock, highlighting which markets absorbed the volatility and which amplified it.
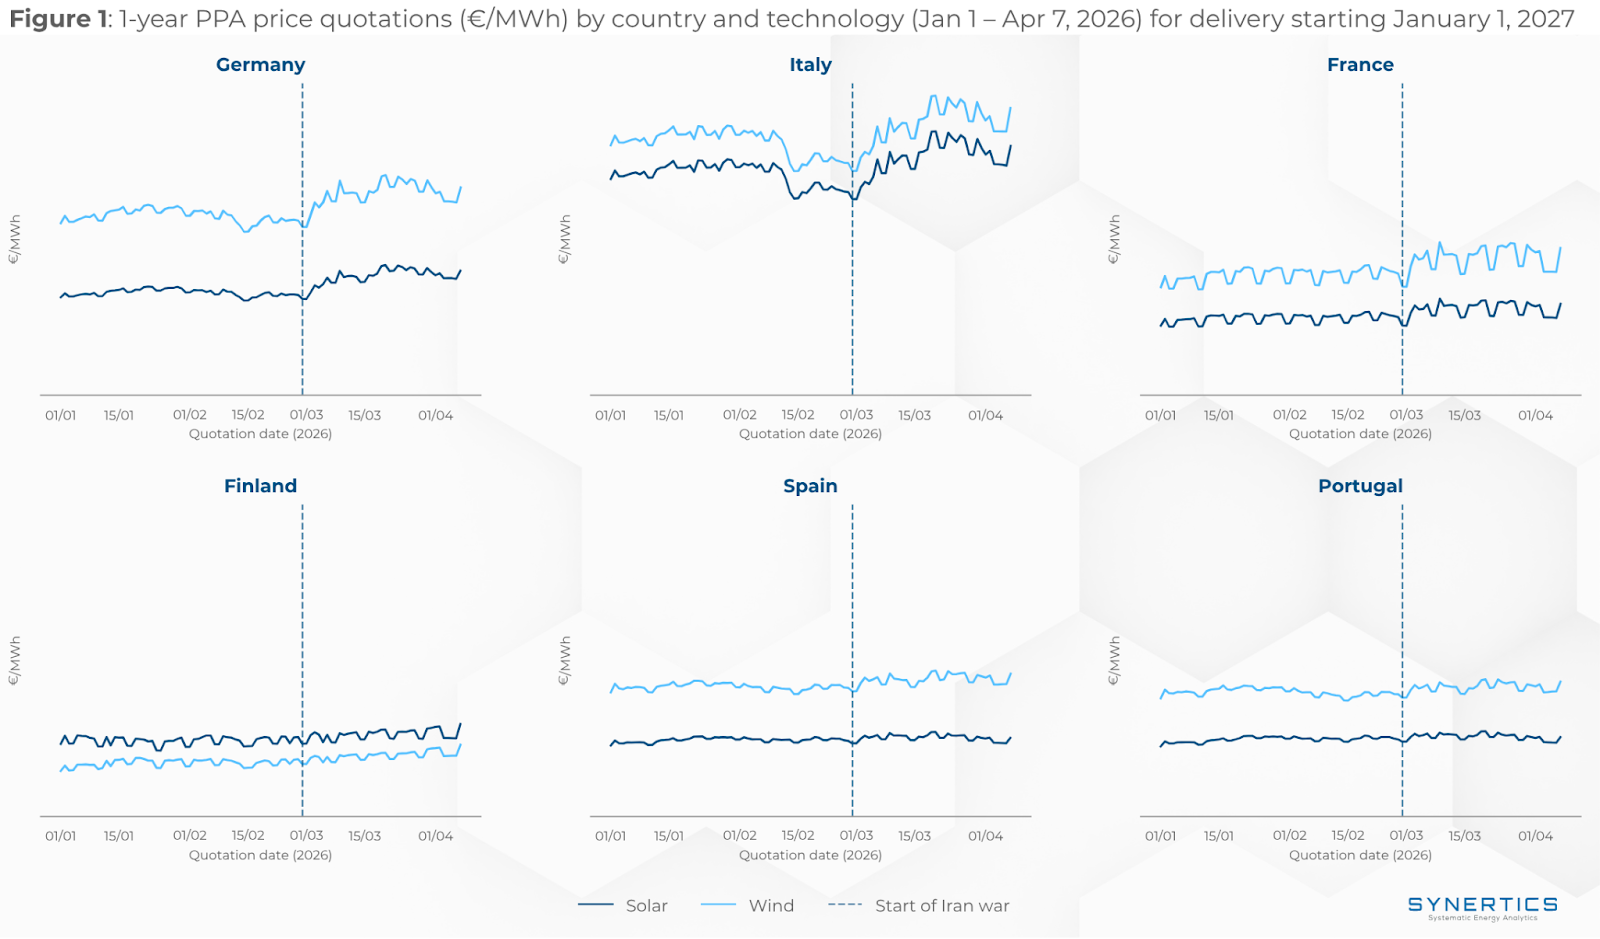
Germany, with a fossil share of 41%, was among the most affected markets. As of 28 February, Germany’s gas storage levels stood at just 20.58%, leaving the market with a thin buffer as the conflict escalated. Looking at averages before and after the conflict, wind rose 12.8% and solar 16.3%. This significant shift is a direct reflection of the country's continued exposure to gas price volatility and highlights how fossil fuel volatility still dictates the benchmarks for renewable short-term PPA pricing during a geopolitical shock.
Italy’s market reaction was driven by a 51% fossil share (the highest among the studied markets) compounded by gas inventories that stood at 47.60% as the conflict began. While averages before and after the conflict show modest gains of 7.6% for wind and 8.0% for solar, these figures understate the true spike, as prices had fallen sharply in mid-February just before the war began. Comparing that pre-war low to the levels seen since the start of the conflict, solar and wind rose 16.2%, a far more accurate reflection of the conflict's effect on Italian PPA prices.
France's electricity mix is dominated by nuclear (68.8%), with just 5.2% fossil. Despite this low fossil dependence, French PPA prices increased significantly: solar rose 12.4% and wind 14.4%. This reaction was intensified by gas storage that stood at 21.38% as the conflict began, leaving the market vulnerable to cross-border price coupling with Germany. When German power prices spiked, French prices followed in sympathy due to the integrated European grid.
Finland sits at just 3.7% fossil, with nuclear (39.9%) and renewables covering the rest, making it the most competitive market for wind PPAs in this study. However, even this low-price haven was not immune; solar rose 8.4% and wind 14.5%. With no domestic gas storage to act as a buffer, Finnish prices were pulled upward by the general uplift across European power benchmarks.
Spain (25% fossil) saw modest increases, with solar rising 3.2% and wind 5.9%. The market benefited from gas storage levels of 55.81% at the start of the conflict, providing a solid buffer. This, combined with limited energy interconnections with the rest of Europe (with only one link to France), effectively insulated Spain from the price spikes seen in Central European markets.
Portugal was the least affected market, with solar rising just 3.4% and wind 4.0%. With 81% renewable electricity and only 19% fossil, plus a strong 76.72% gas storage level and sharing the same grid isolation as Spain, Portugal's PPA prices remained largely stable throughout the conflict period.
Within the short-tenor PPAs, location and grid connectivity were the primary drivers of volatility. Markets with high fossil fuel dependency, such as Italy and Germany, saw the most significant shifts, with average increases for solar and wind reaching as high as 16%. Even low-fossil markets like France and Finland were not immune, seeing surges of 8–15% due to cross-border price coupling and the general uplift in European benchmarks. In contrast, Spain and Portugal remained the most stable, with increases limited to 3–6%, a result of their high renewable penetration and geographical isolation from the price shocks of Central Europe.
Source: Gas storage data provided by GIE (AGSI).

 5 min
5 min

Insights, Market-trends, Announcements
30th Jul, 2026
4 min

Insights, Market-trends
12th Jun, 2026
8 min
Insights, Market-trends
11th Jun, 2026