Join us on our journey towards renewable energy excellence, where knowledge meets innovation.

Guarantees of Origin (GoOs) are certificates issued under the Association of Issuing Bodies (AIB) framework: every time a renewable asset produces energy, a corresponding certificate is generated and can be sold to companies looking to back their consumption with verified green energy. With electricity demand set to rise on the back of the digital boom, GoOs represent a meaningful additional revenue stream for producers and reinforce the investment case for renewable projects.
GoO prices vary depending on a number of factors, as covered in our earlier piece Key-Factors shaping the GoOs market and future outlooks. In this post, Synertics breaks down how future GoO prices behaved across 2025 and 2026, tracing the seasonal forces that drive them, the moments where that pattern was disrupted, and why solar producers tend to be the most exposed.


Future GoO prices are shaped by two forces. On the demand side, corporate buyers drive most of the volume as they work to meet sustainability targets and obligations, which is demand is relatively inelastic and tends to concentrate around reporting cycles, typically Q1 and Q4. On the supply side, producers control when they issue and sell certificates, timing their decision around their generation outlook and confidence in delivering the promised volumes.
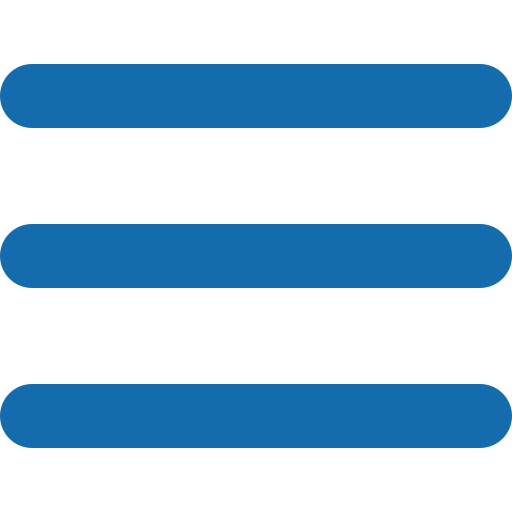
The market clears where these two sides meet and the balance shifts predictably with the seasons. Figure 1 shows future GoO prices from end-2024 to 2026 for generation years 2026-2029, as seen in the Synertics tool. To better understand how these dynamics play out in practice, a few recurring seasonal patterns can be identified.
Winter is typically where the sharpest drop in future prices occurs. With shorter days and weak sunlight, solar generation is low and its expected contribution to GoO supply negligible. As for hydro reservoirs, during this time they hold the water built up from autumn rainfall. Wind energy typically runs strong, giving producers confidence in their ability to deliver and keeping forward supply expectations high. Meanwhile, many corporate buyers are closing out the prior reporting year, which sustains demand. However, the anticipated abundance of wind supply is sufficient to absorb this demand pressure, preventing any price recovery. As a result, future price levels are driven more by buyer urgency to meet reporting deadlines than by any reluctance from producers to sell forward.
In spring, prices step away from the winter drop to a steady decline. Usually by this point, hydro reservoirs have reached their safe holding capacity through rainfall and snowmelt, reaching the point where operators need to discharge and generate rather than spill. This floods the market with hydro GoOs, particularly Norwegian and Alpine, at exactly the moment corporate demand is cooling off after the Q1 reporting rush. The result is the steady decline visible from February through May across all future years of production. To remain competitive wind and solar producers have to bring their own prices down, but they sit at a structural disadvantage: hydro generation is effectively weather-independent once the reservoir is filled, so its delivery risk is negligible, whereas wind and solar still carry real production uncertainty. With hydro anchoring forward supply and perceived delivery risk low across the board, spring tends to be the cheapest window to buy GoOs.
After the steady decrease seen in spring, summer is where prices tend to rise. From the producer's perspective, the logic often goes: the harder it is to guarantee delivery, the higher the price demanded to commit to it. Summer is where that uncertainty peaks. As renewables integrate more deeply into the market, solar production pushes spot power prices to their lowest levels of the year and with limited participation in balancing markets (such as aFRR and mFRR up regulation), the expected revenue environment for producers weakens. This makes the parks more cautious about committing volumes they aren’t fully confident they can monetise. All renewables are affected, but solar in particular faces a paradox: summer is when it can produce the most, yet market competition during peak generation hours puts the realisable value of that output in doubt. That uncertainty is what the GoO price is compensating.
After the July peak, prices typically step down through autumn into winter. On the supply side, hydro rebuilds with autumn rainfall and wind output recovers, unwinding the summer uncertainty. On the demand side, corporates begin lining up certificates for year-end reporting, causing demand to tick up again. These two forces show up in the figure as the gradual price decline from August 2025 through late January 2026.
As the 2026 generation year approached its closing window, the remaining years were hit by an unexpected event. The escalation of the conflict in Iran pushed GoO prices sharply higher across the forward curve. One possible explanation is that corporates, suddenly exposed, shifted to a volume-securing strategy, while producers seized the opportunity and pushed prices further up, driving a rapid spike across all renewable GoOs. When the conflict eased in April, the drop was almost instantaneous, with prices returning to the seasonal patterns seen during 2025.
Guarantees of Origin are an increasingly important support for renewable investment and a meaningful revenue stream for producers. Taking 2025 and 2026 as examples, summer is consistently the season where prices rise the most, as producers face the weakest market conditions to monetise their generation. Winter and autumn are when buyers are most active, as they negotiate GoOs at a lower price and can use them later on.
Solar parks are the most exposed: their peak production coincides with the lowest spot prices, which compresses revenues at exactly the moment generation is highest. Wind extracts more as its peak tends to align with seasons where there is a higher demand.
For producers looking to reduce this uncertainty, PPAs remain a good reliable instrument. In most PPA structures, the GoOs are bundled into the deal at a fixed price, insulating both parties from the seasonal and geopolitical swings the unbundled market goes through.
Sources:
https://www.aib-net.org/facts/european-residual-mix

 13 min
Insights
16th Jul, 2026
4 min
Insights, Market-trends
12th Jun, 2026
4 min
Insights, Market-trends
12th Jun, 2026