Join us on our journey towards renewable energy excellence, where knowledge meets innovation.

Why does the duck curve matter in the era of solar power? Discover its significance and implications for our grids.


Quick Definition: What is the Duck Curve?
The duck curve is a graph of electricity net demand over a day in a grid with high solar penetration. It dips in the middle of the day (when solar output is high) and spikes steeply in the evening (when solar drops and demand peaks). The shape resembles a duck. It is a key challenge for grid operators managing renewable energy integration.
The duck curve is a concept used in the field of energy and electricity grid management, particularly in the context of renewable energy integration, such as solar and wind power.
Its distinctive shape resembles the profile of a duck, with a flat belly during the day, and a long neck representing the steep upward slope in the evening.
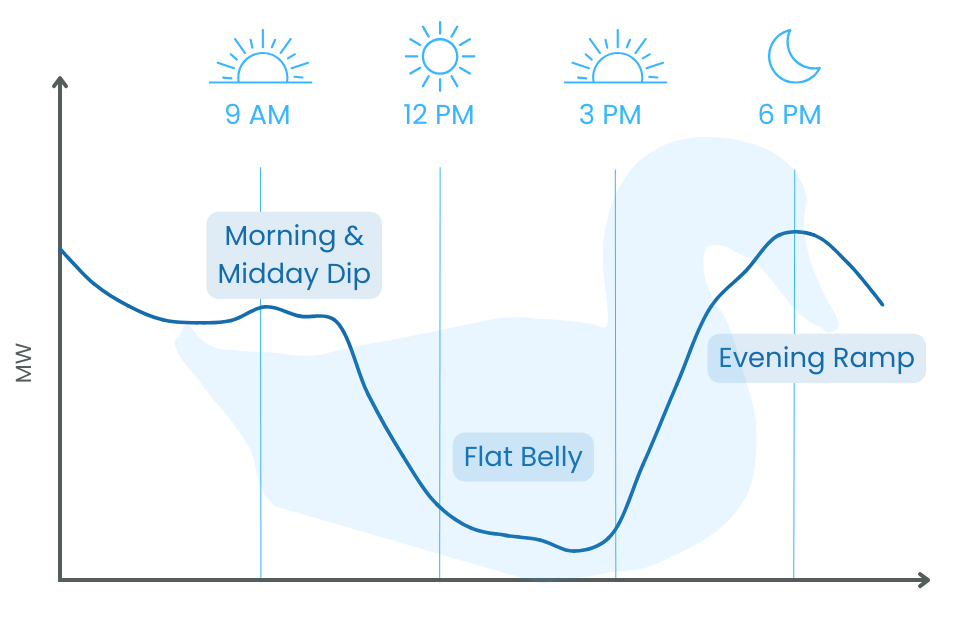
Here's a breakdown of the key features of the duck curve:
Morning and Midday Dip: The curve starts with a pronounced dip in electricity demand during the morning and midday hours. This dip is primarily a result of the increased generation of solar power during daylight hours.
Flat Belly: The middle part of the curve shows a relatively low and stable electricity demand during the day, thanks to the abundant solar generation. This can lead to a surplus of electricity during sunny days.
Evening Ramp: As the sun begins to set and solar generation decreases, electricity demand starts to rise, creating a steep upward slope in the curve. This steep increase in demand is often referred to as the "ramp."
The duck curve illustrates the challenge of balancing electricity supply and demand when renewable energy sources like solar and wind, which are intermittent and weather-dependent, are a significant part of the energy mix.
Solar power's peak production aligns with midday when electricity demand typically dips. Consequently, there is an excess of energy production, leading to a reduction in net demand (total demand minus wind and solar production). However, as the evening approaches, net demand surges, coinciding with a decline in solar power generation.
This disparity has become increasingly pronounced over time due to the continual expansion of solar capacity, causing midday net demand to decrease progressively. Therefore, there is a need to promptly supplement this reduction in generation with substantial energy inputs to ensure a stable power supply during peak demand hours. Moreover, while high renewable generation during daylight hours can result in an overabundance of electricity being fed into the grid by PV technologies, it can also cause a significant price drop, potentially blocking new investments in these utilities.
Grid operators and utilities must adapt to manage this changing demand pattern and ensure grid stability. This may involve strategies such as energy storage (like batteries), demand response programs, flexible generation sources, and grid management tools to address the variability in renewable energy generation and avoid over-generation during sunny periods and potential supply shortages during the evening peak.
The duck curve is a valuable concept for understanding the complexities and opportunities associated with integrating renewable energy into the electrical grid effectively. It highlights the need for grid modernization and flexibility to accommodate the changing dynamics of energy production and consumption.
The duck curve is a graph showing net electricity demand (total demand minus solar and wind output) over the course of a day. It dips during midday when solar generation peaks, then rises steeply in the evening as solar drops off and demand increases. The resulting shape resembles a duck.
The name comes from the shape of the net demand graph: a low, flat middle section (the belly of the duck) followed by a steep evening rise (the neck and head). The term was popularised by the California Independent System Operator (CAISO) around 2013.
The steep evening ramp requires grid operators to rapidly bring online large amounts of dispatchable generation in a short time window. This puts pressure on conventional power plants, increases balancing costs, and can compromise grid stability if not managed properly.
During the midday dip, excess solar generation can push electricity prices down to zero or even negative. In the evening, the sudden surge in net demand can cause prices to spike sharply. This price volatility directly impacts the revenue of renewable energy generators and influences PPA pricing.
The main solutions include battery energy storage systems (BESS) to absorb excess midday generation and discharge in the evening, demand response programs to shift consumption away from peak hours, flexible generation sources such as gas peakers, and improved grid interconnections to distribute surplus energy across regions.
Synertics provides advisory services and develops digital data-driven solutions for the energy industry with the purpose of driving productivity and transferring knowledge.

 5 min
5 min

Insights, Market-trends, Announcements
30th Jul, 2026
3 min
Insights, Announcements
29th Jul, 2026
3 min
Insights, Announcements
29th Jul, 2026