Join us on our journey towards renewable energy excellence, where knowledge meets innovation.
For the past 18 months, Europe’s energy markets have been exposed to socioeconomic and climate instability, affecting their imbalance costs.

Imbalance costs refer to the expenses incurred by energy market participants due to deviations between contracted and actual energy supply or demand. These imbalances between scheduled and actual energy flows can vary depending on the specific energy market and its regulations.
As we analyzed data from four different corners of Europe, we wondered why geographically distant markets, such as Spain and Sweden, are featuring similar imbalance curve patterns and what has led to such behaviors.
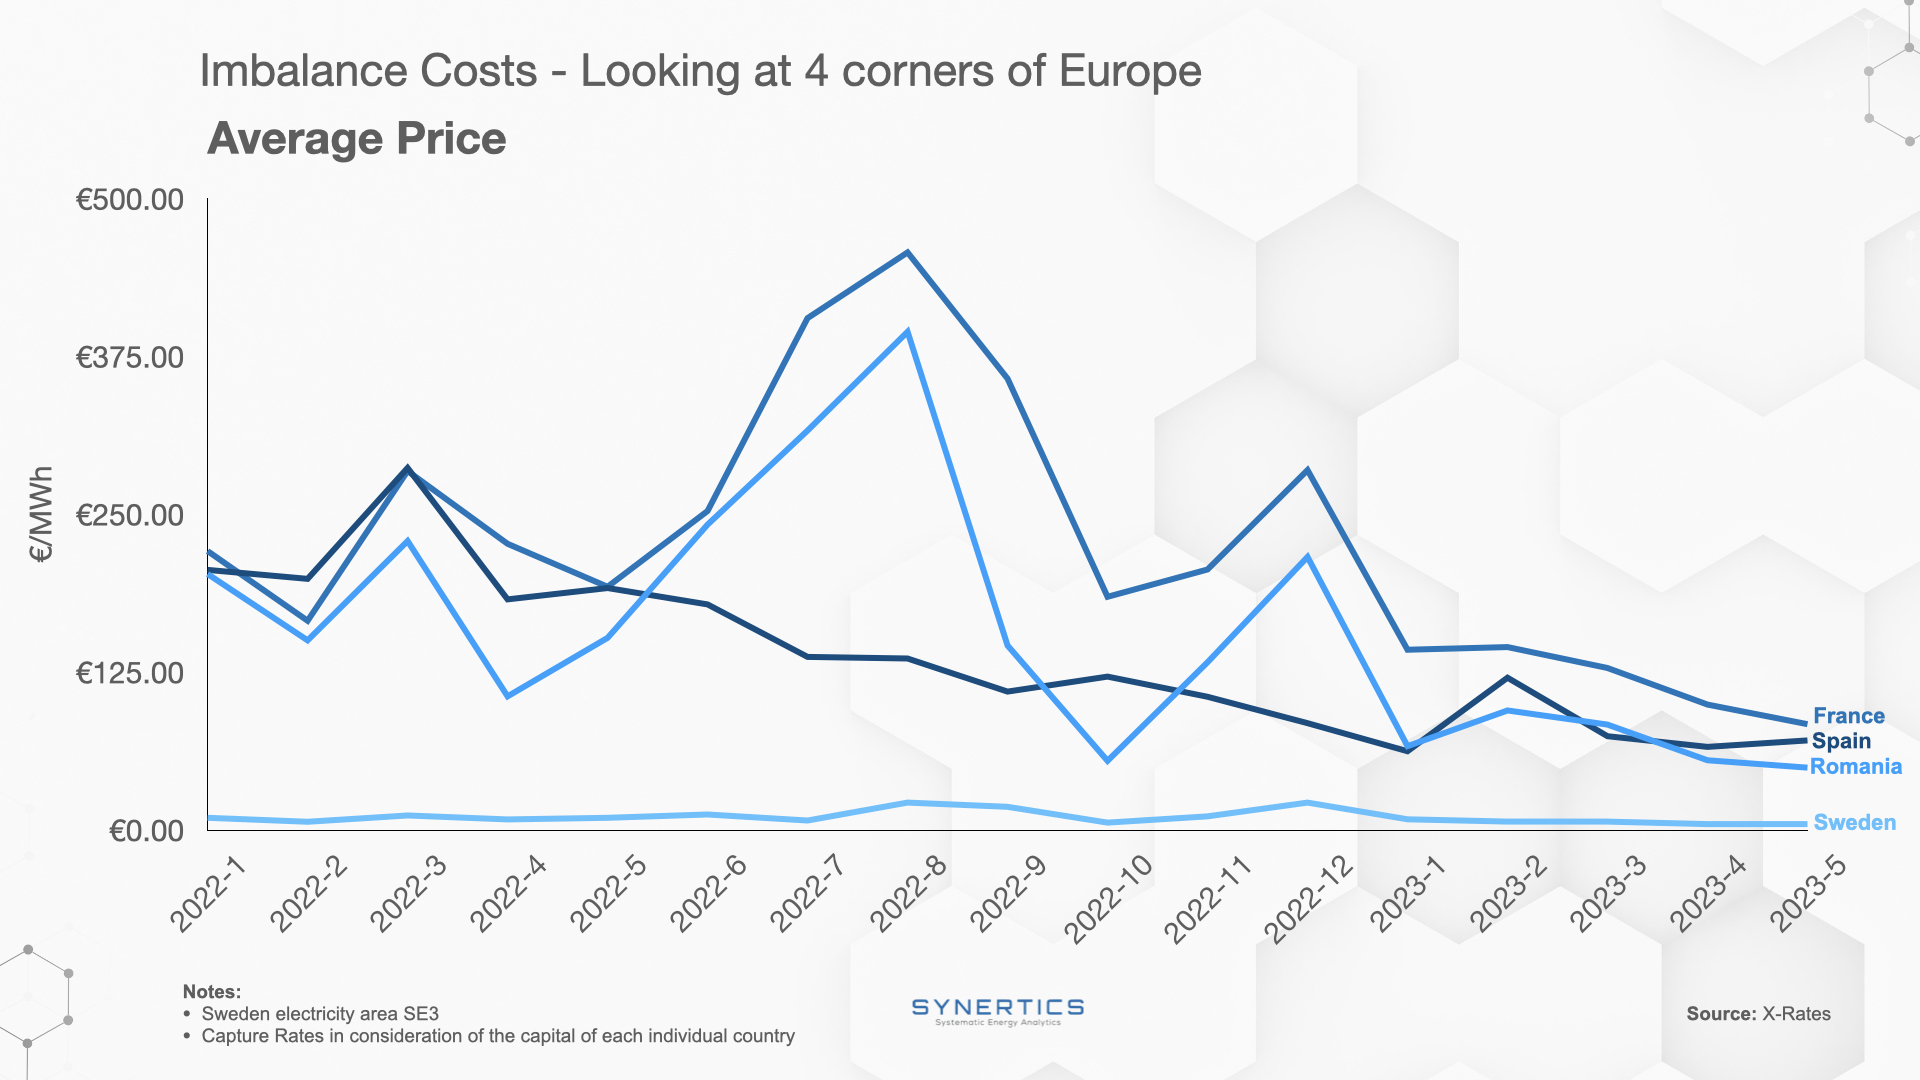
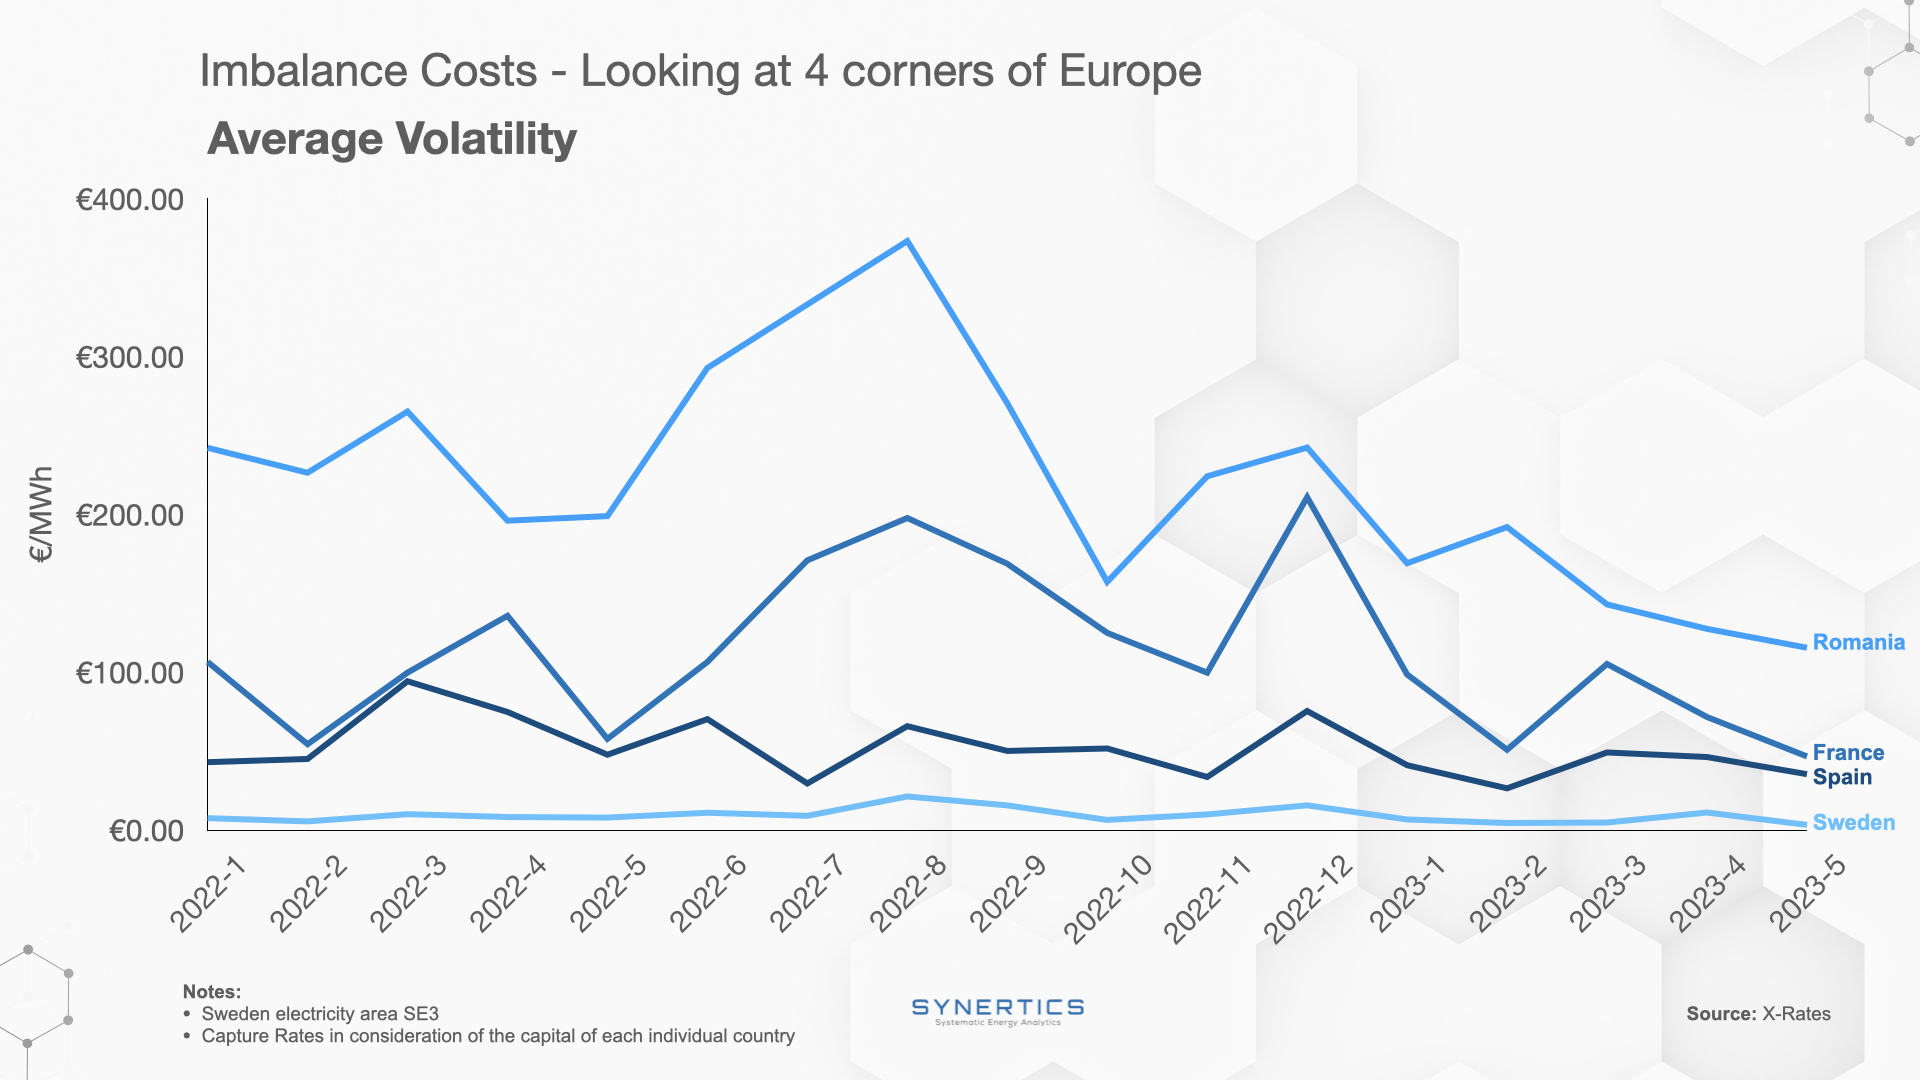
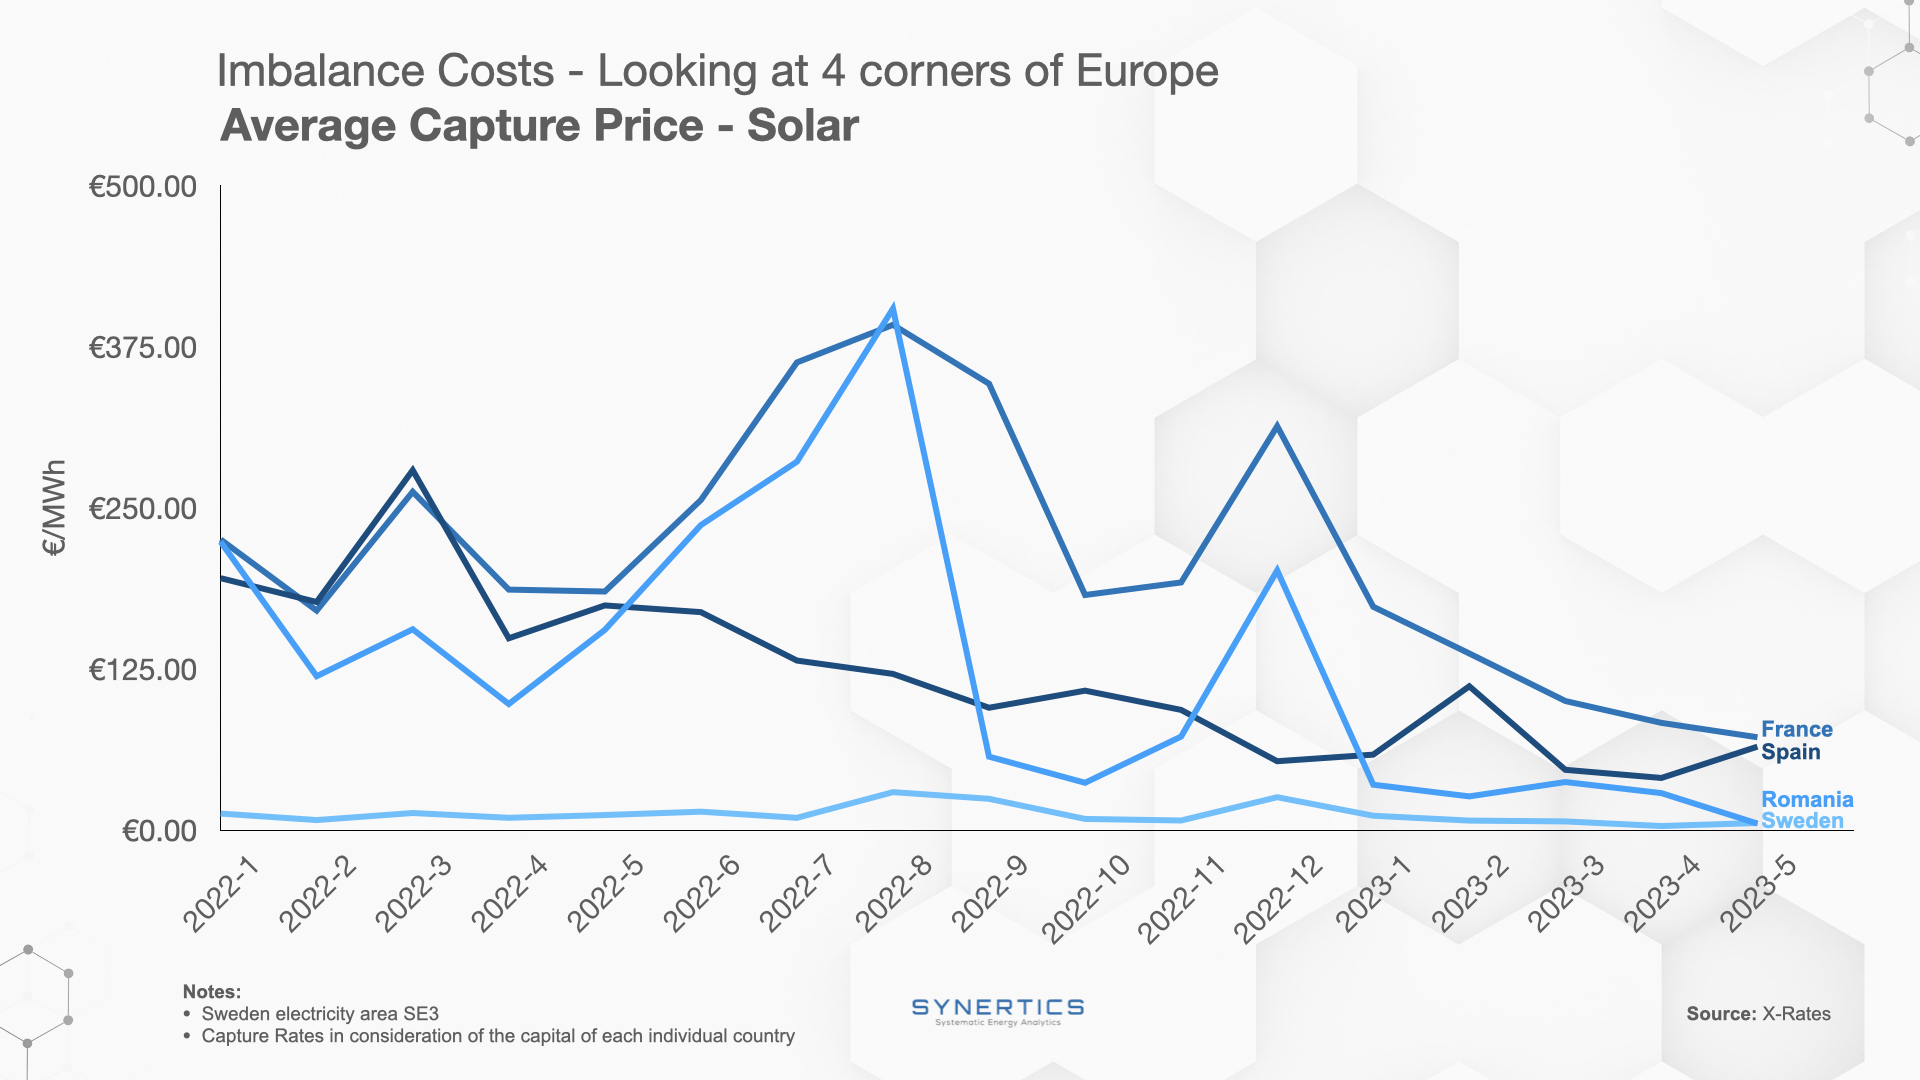
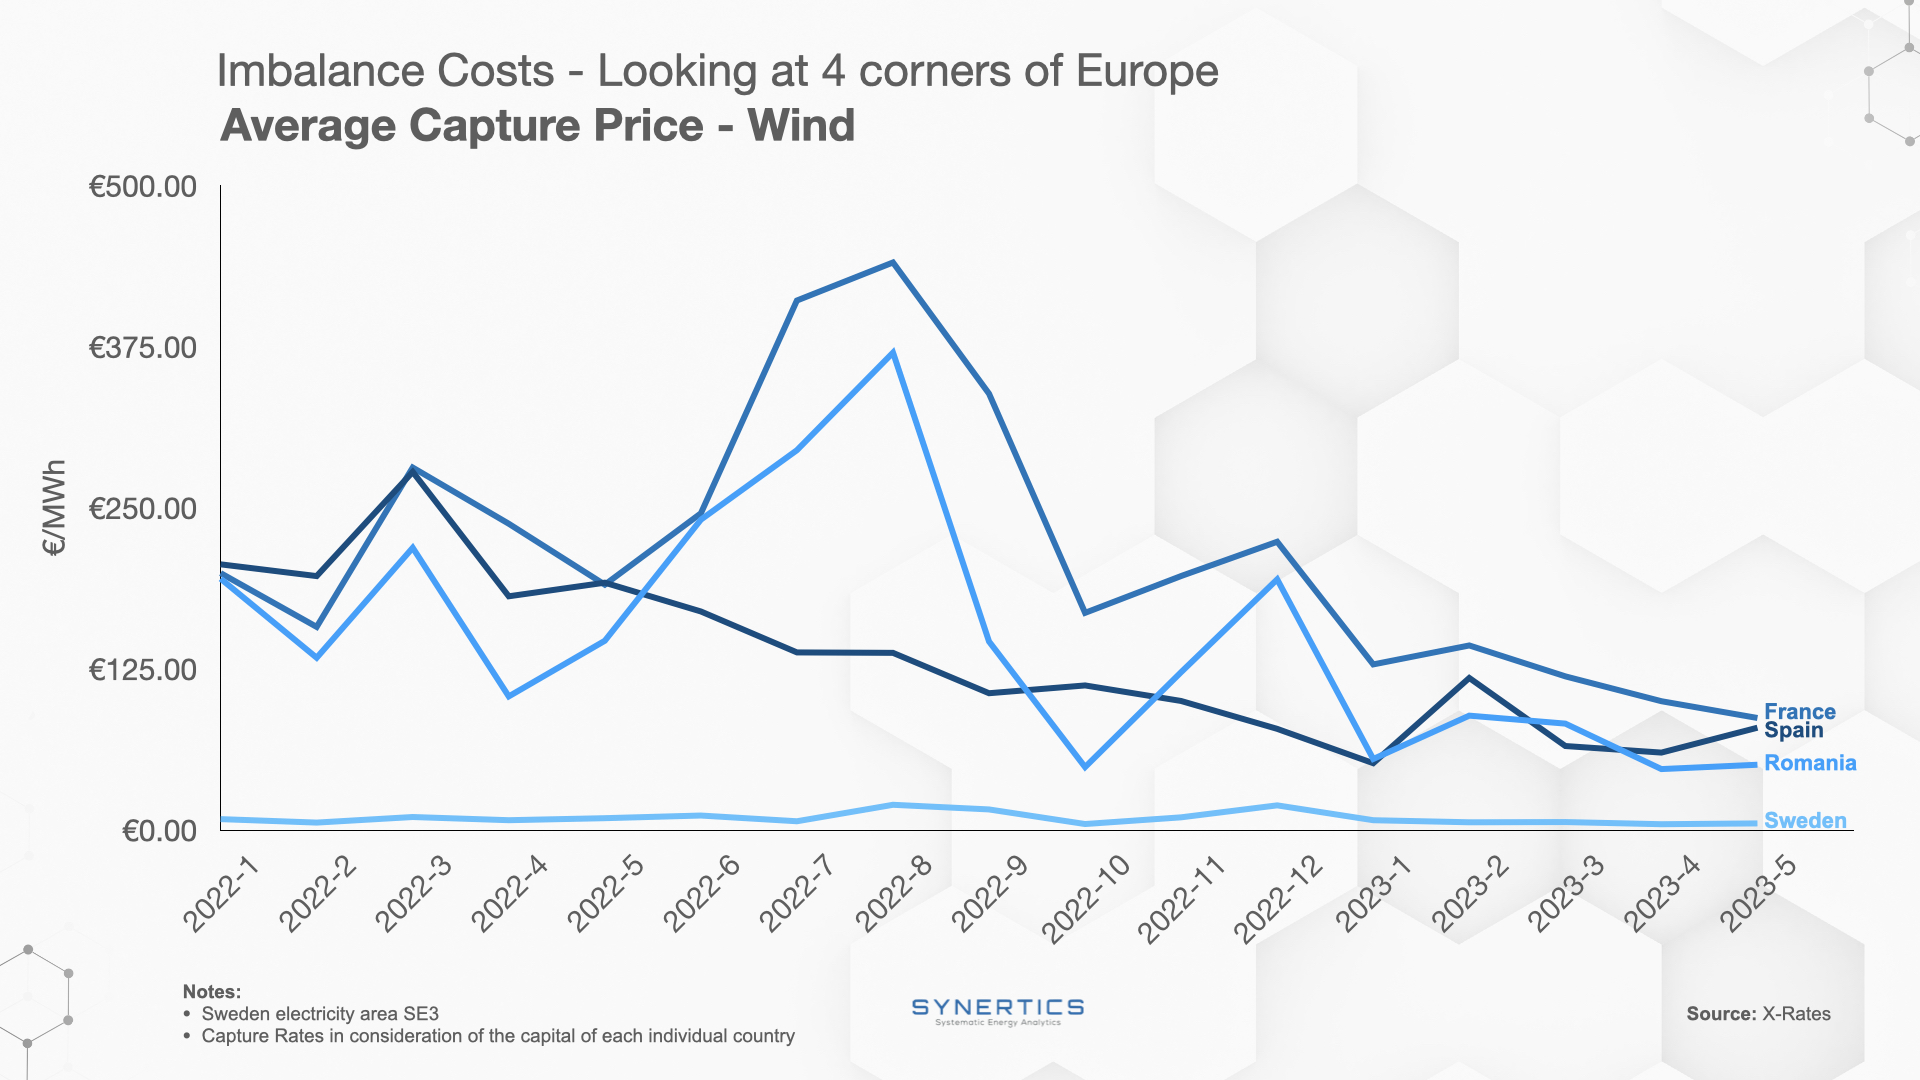
In order to better understand these behaviors registered in the graphs below, we have listed some of the main drivers behind imbalance costs that can provide us with the answer:
Forecasting Errors: Energy market participants forecast energy demand and supply to maintain system balance, but errors can arise from weather changes, consumer behavior shifts, or inaccurate models. These errors cause imbalances between scheduled and actual energy usage, leading to imbalance costs.
Variable Renewable Energy: The variability and intermittency of sources such as wind and solar make it challenging to predict their output accurately. Fluctuations in renewable energy generation can lead to imbalances and subsequent imbalance costs for market participants.
Demand-Side Variability: Changes in electricity consumption patterns due to factors such as weather conditions, industrial activity, and consumer behavior can lead to imbalances. For example, a sudden increase in air conditioning usage during a heatwave can create a demand-supply gap. Thus requiring market participants to balance the system, incurring imbalance costs.
Transmission Constraints: Constraints in the transmission infrastructure can prevent the efficient transfer of electricity from surplus regions to areas with high demand. This can result in localized imbalances and associated costs for managing the imbalances.
Market Design and Regulation: The specific market design and regulatory framework can influence the magnitude of imbalance costs. For instance, market rules, imbalance settlement periods, penalties, and pricing mechanisms can impact how imbalances are managed and who bears the associated costs.
Inflexible Generation or Load: Infrastructural limitations, maintenance schedules, or contractual obligations can restrict the flexibility of generators or large consumers. Inflexibilities in responding to changes in supply or demand can contribute to imbalances and increase imbalance costs.
Trading and Hedging Strategies: Energy market participants often engage in trading and hedging activities to mitigate risks associated with imbalances. However, imperfect trading strategies or inefficient hedging decisions can result in residual imbalances, leading to additional costs.
Which of the listed drivers do you think is likely to be responsible for the disruptive market behavior characterizing imbalance costs in Europe for the past 18 months?
Synertics provides advisory services and develops digital data-driven solutions for the energy industry with the purpose of driving productivity and transferring knowledge.
Market-trends
6th Feb, 2026
Insights, Market-trends
15th Dec, 2025
Market-trends, Projects
27th Nov, 2025