
Join us on our journey towards renewable energy excellence, where knowledge meets innovation.

As the Nordic power market adapts to a new imbalance price-setting algorithm introduced in March 2025, generators face a fundamentally altered risk environment marked by higher costs and sharper volatility. The near-disappearance of “zero-cost” hours has removed a crucial buffer, with Sweden and Finland now grappling with frequent, high-risk positive imbalance costs, while Denmark’s DK1 contends with rare but severe negative cost events. These divergent market dynamics underscore the need for tailored, zone-specific strategies, as asset owners navigate both the opportunities and the heightened challenges of operating in this transformed balancing landscape.


As highlighted in a previous Synertics analysis on Sweden and Finland, the introduction of a new price-setting algorithm in March 2025 has triggered a seismic shift, leading to a significant surge in both the average cost and volatility of imbalance prices, reflecting a new paradigm of risk for generators.
This article dives beyond those findings, expanding our analysis to include Denmark's DK1 bidding zone and providing a direct comparison to the market conditions of last year. We will analyse the balancing costs – defined as the spread between the Day-ahead Price and the Imbalance Price – beyond simply identifying the trend and instead offer a strategic guide for how generators can understand and manage their heightened risk exposure in this more volatile environment.
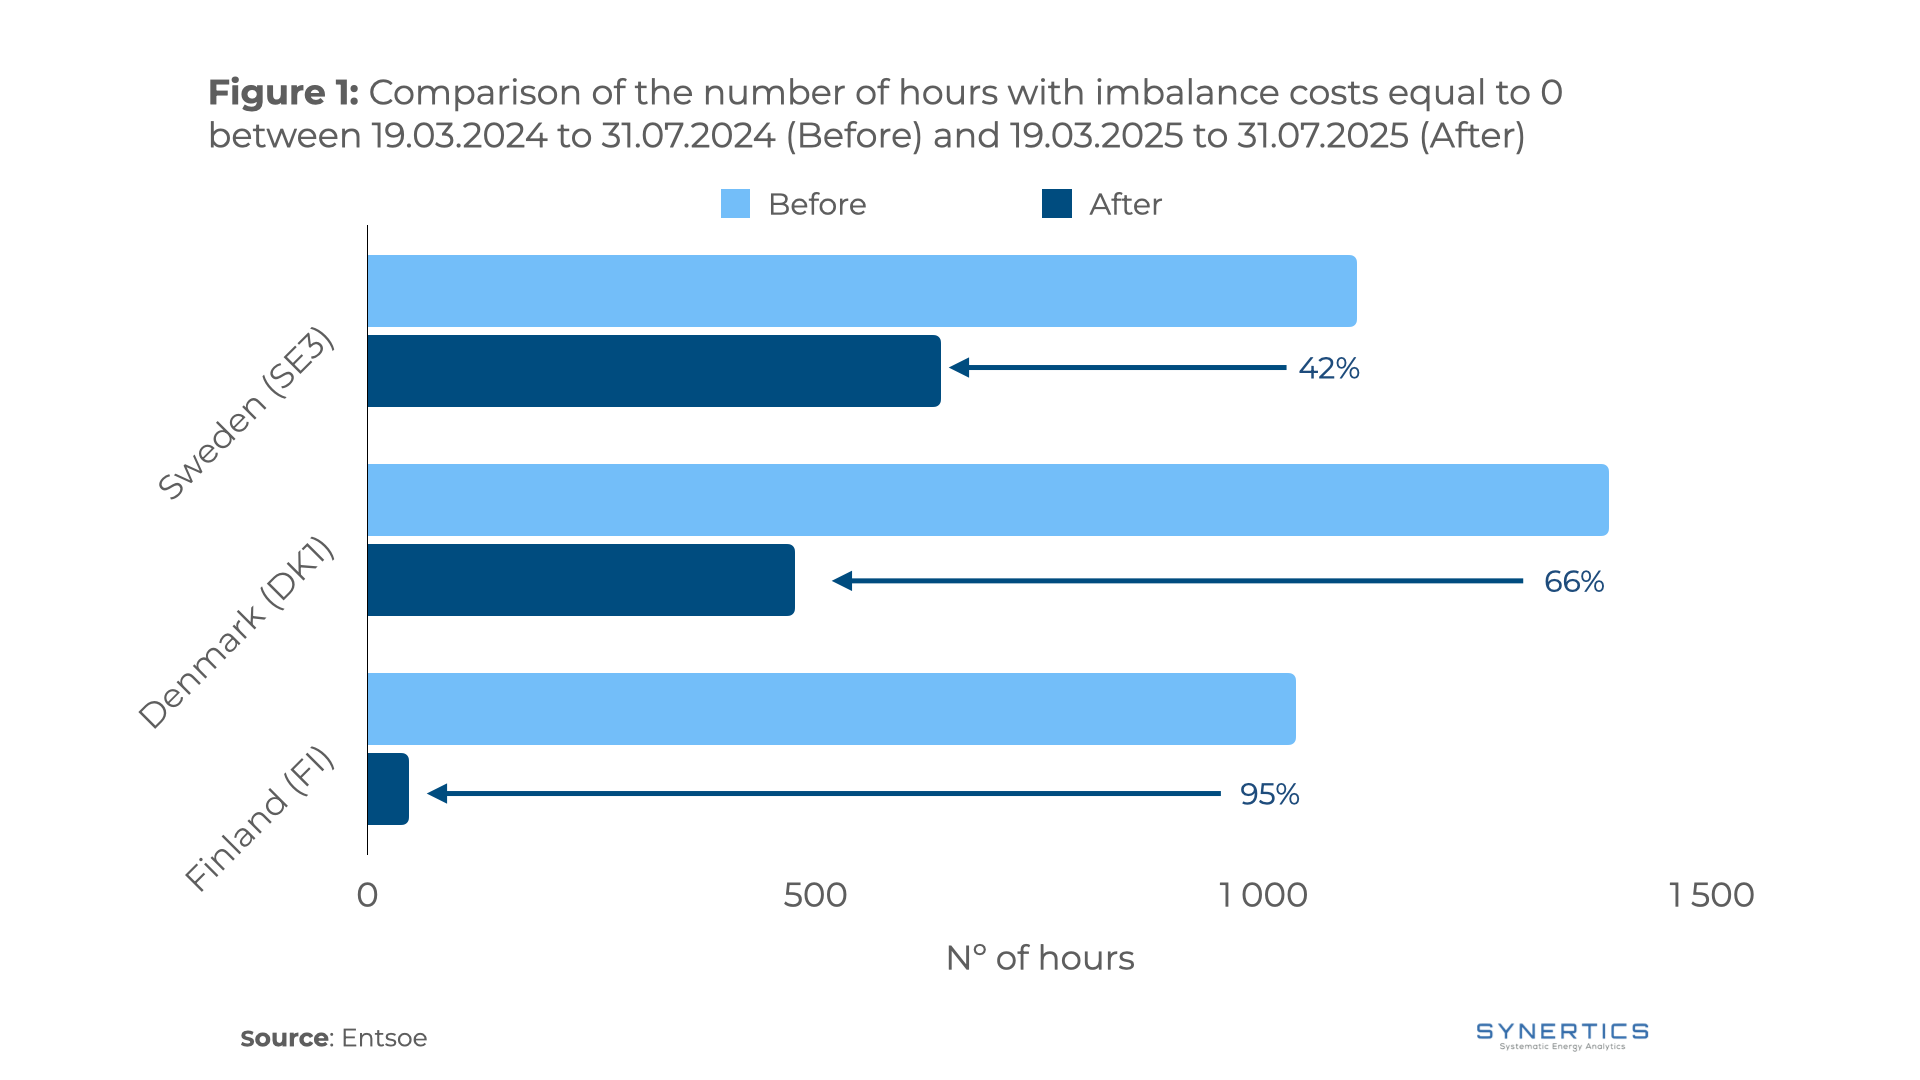
One of the most telling indicators of this new paradigm is the virtual reduction of the "zero-cost" situation. The cost of the risk is linked to the imbalance cost, which is defined by the financial penalty or reward for deviations between forecasted and actual production of a renewable energy project. A positive cost benefits a generator who produces less than scheduled, while a negative cost rewards a surplus of production.
In the past, there were occasional periods where these prices aligned perfectly, creating a zero-risk scenario for imbalances. While never common, this buffer has been almost entirely eliminated by the new imbalance price-clearing algorithm, which sets the price based on the most expensive balancing service activation. The impact has been stark and it's depicted in Figure 1. Across the period from March 19 to July 31, 2025, the number of zero-cost hours plummeted, with Sweden's SE3 zone witnessing a 42% reduction, while Finland saw them virtually disappear with a decrease of 95%. This fundamental change means that every deviation now carries a direct and often significant financial weight.
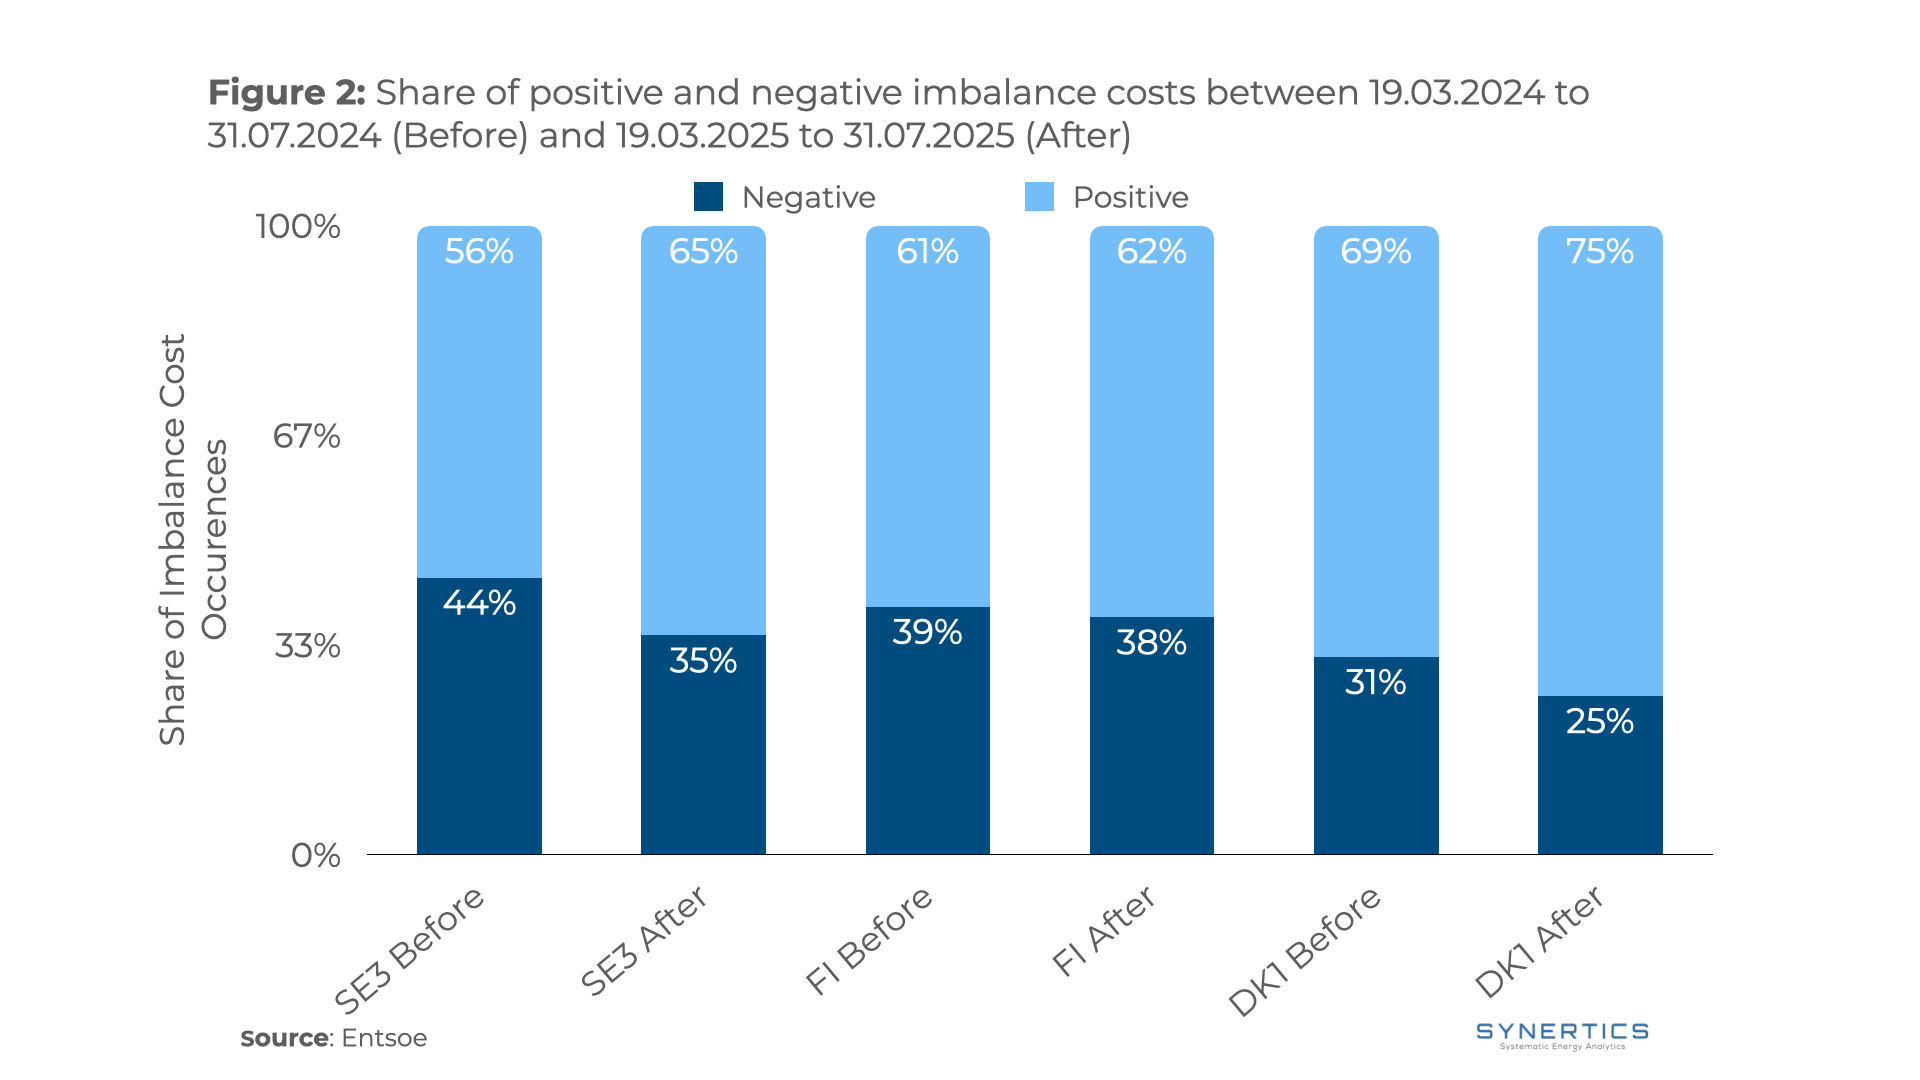
A surface-level look at the data might suggest a simple strategy. As Figure 2 shows, there has been a clear and consistent increase in the share of hours with positive imbalance costs across all analysed bidding zones compared to the homologous period in 2024. This trend is most pronounced in DK1, where negative imbalance costs now occur only 25% of the time. Intuitively, this high frequency of positive costs might tempt a generator to consistently aim for a negative imbalance to capitalise on the prevailing market direction.
However, this frequency masks a more complex reality. A granular look at the data, as detailed in Table 1, reveals a critical divergence in risk profiles that tells a much different story.
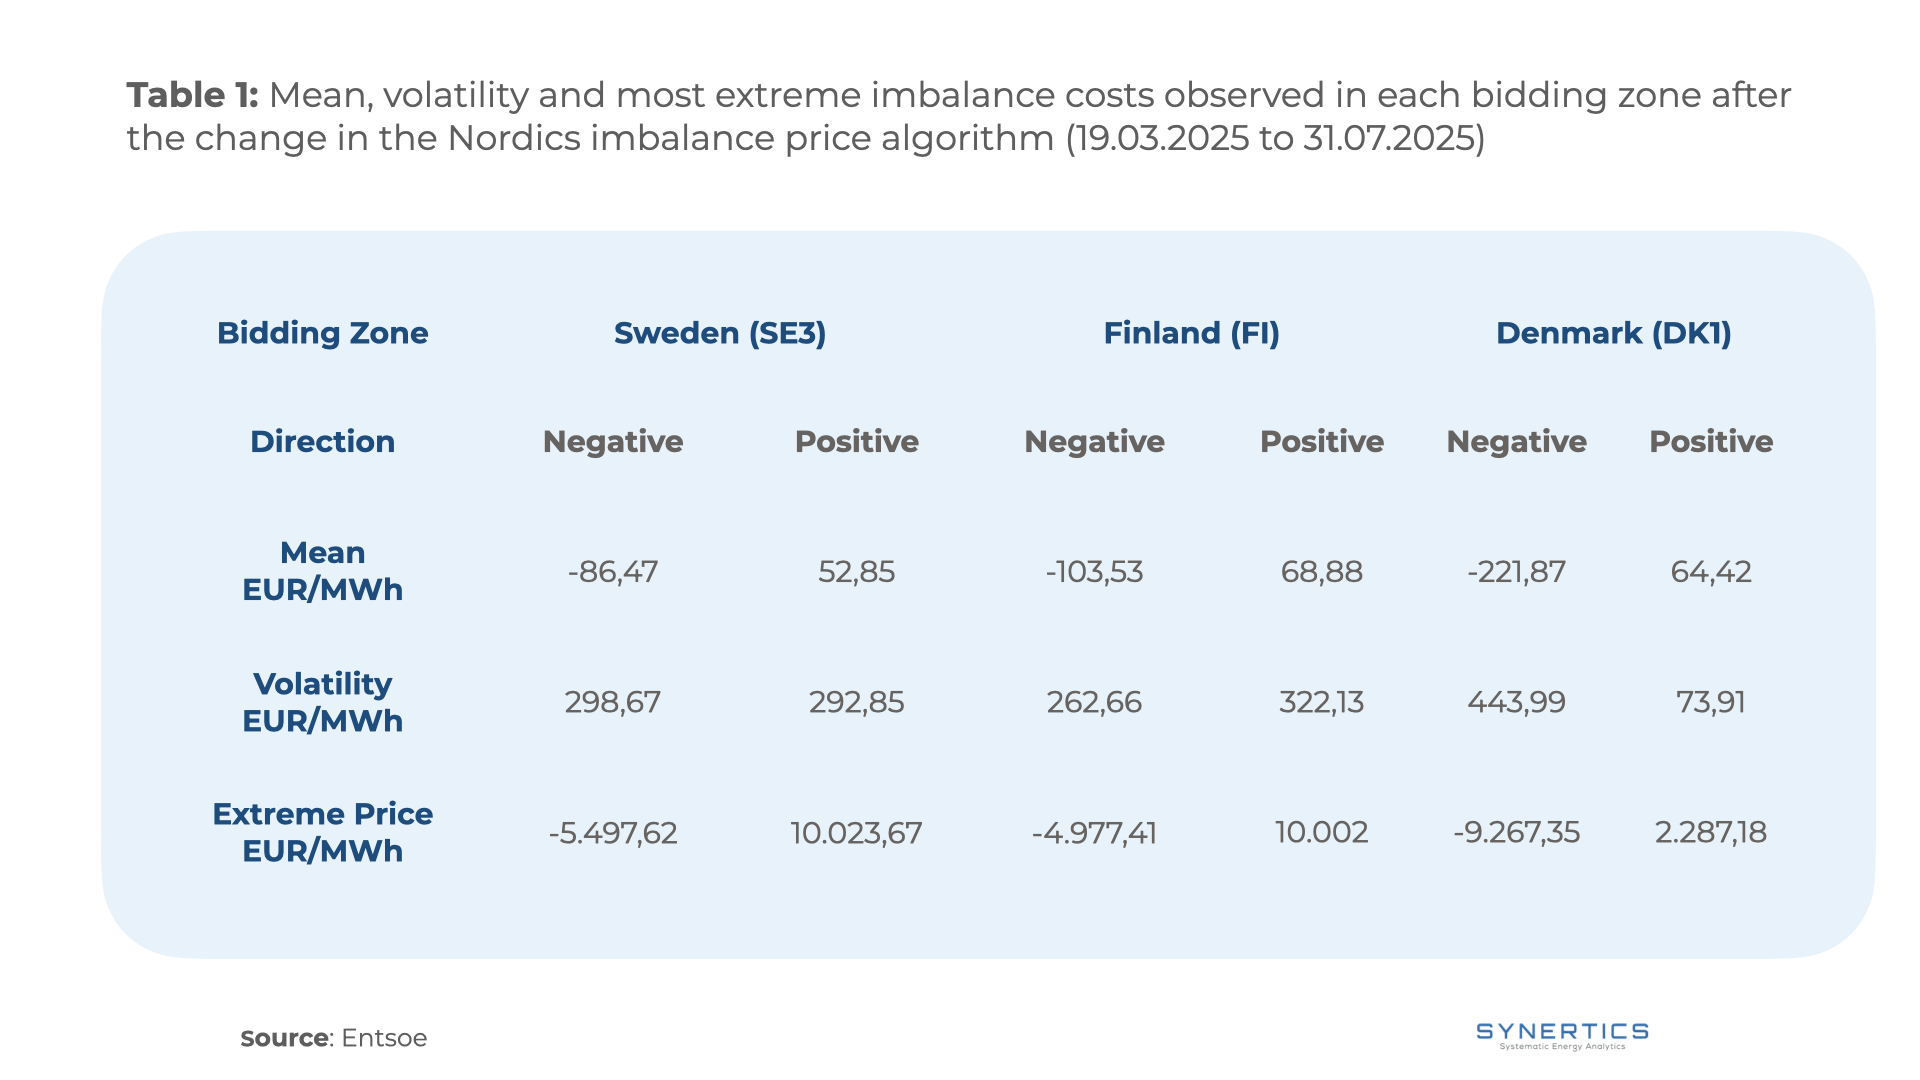
In SE3 and Finland, while negative imbalance costs have a higher average price, the volatility is comparable for both directions. More importantly, the extreme tail risk, the potential for a catastrophic single-event loss, is on the positive cost side. This combination of frequent positive costs and their longer tail risk points toward effective risk management by actively avoiding negative imbalances.
In contrast, Denmark's DK1 presents a whole different story. The frequency of negative imbalance costs is low, but with an increased financial impact. The average negative cost is nearly four times higher than the positive average, and the volatility is over six times greater. This creates a "low-frequency, high-impact" risk scenario, where the financial devastation from a single negative imbalance event far outweighs the small, frequent gains from positive costs. This compels a risk mitigation strategy that seems paradoxical: it may be prudent to deliberately create a production surplus simply to avoid the potential exposure of the negative imbalance costs.
The structural changes in the Nordic balancing market have fundamentally brought a new paradigm of risk management. While a superficial glance at imbalance frequency might suggest a simple path forward, a deeper analysis reveals a more complex and geographically diverse risk landscape that demands a more sophisticated approach.
In Sweden and Finland, the evidence points towards a strategy of carefully avoiding production surplus, given the high frequency and significant tail risk of positive imbalance costs. The Danish market, however, presents a counter-intuitive challenge where the extreme severity of negative costs makes avoiding production deficit a critical priority.
These divergent risk profiles mean that risk management strategies need to be carefully assessed, especially for assets with high market exposure. Although the analysis here provided offers a good understanding of general best market practice, if an asset possesses a PPA or a FiT, a more tailored analysis is needed. Ultimately, success in the new Nordic market will belong to those who can dissect the specific risk profile of their bidding zone and tailor their operational and contractual strategies accordingly.
Would you like to review your route-to-market strategy or stay on top of balancing costs in the Nordics? Try our tool and book your meeting today!

 5 min
5 min

Insights, Market-trends, Announcements
30th Jul, 2026
4 min

Insights, Market-trends
12th Jun, 2026
8 min
Insights, Market-trends
11th Jun, 2026