
Join us on our journey towards renewable energy excellence, where knowledge meets innovation.

The trend of increasing negative-price hours has continued across Europe this year. These values are already close to or exceeding the records set in 2024. While low wholesale prices are beneficial for many electricity consumers, frequent negative prices pose problems for the power market and PPA deals. This trend impacts PPA negotiations, particularly PPA prices, as they must account for the associated risks. As a result, some countries might be currently more exposed to others to these events.
With this post, Synertics aims to identify which EU countries and renewable technologies have been most affected by negative-price hours in the last 12 months, based on the volume of energy falling into these hours and the average price of the negative periods for those countries, and to highlight the operational and market tools being implemented to reduce their occurrence.


The increasing occurrence of negative price periods mainly driven by the rapid expansion of renewable generation and other factors such as grid bottlenecks or regulatory issues have strongly increased the complexity and difficulty when closing PPAs. There is not a general consensus between renewable energy producers and offtakers on how to handle negative price periods, which significantly increases PPA transaction risk. There are many different approaches on how to contractually handle settlements during negative price periods, some of which are described in previous Synertics post, “How to Manage Negative Prices in PPAs: Key Strategies for Mitigating Risk”.
For this analysis, Synertics looked at 11 European countries between November 2024 and October 2025, using the specific solar PV and onshore wind generation profile of each country. To assess how negative-prices events affect different regions of Europe, Synertics used as indicators:
The negative price exposure of wind and solar energy generation is quite distinct, as depicted in Figure 1. Wind assets consistently exhibit lower exposure, with percentages of energy exposed to negative prices typically ranging from 0% to 10%. Solar power, in contrast, demonstrates a higher and more varied exposure, generally showing values between 5% and 20%. This disparity is assumed to stem from the strong influence solar generation has on triggering negative price occurrences in many countries. Specifically, when the market enters daylight hours, substantial volumes of solar energy simultaneously flood the market. This oversupply and resulting grid congestion often lead to the negative-price events. In contrast, the volumes of wind generation exposed to these price lows are considerably lower and less due to its more diversified production profile.
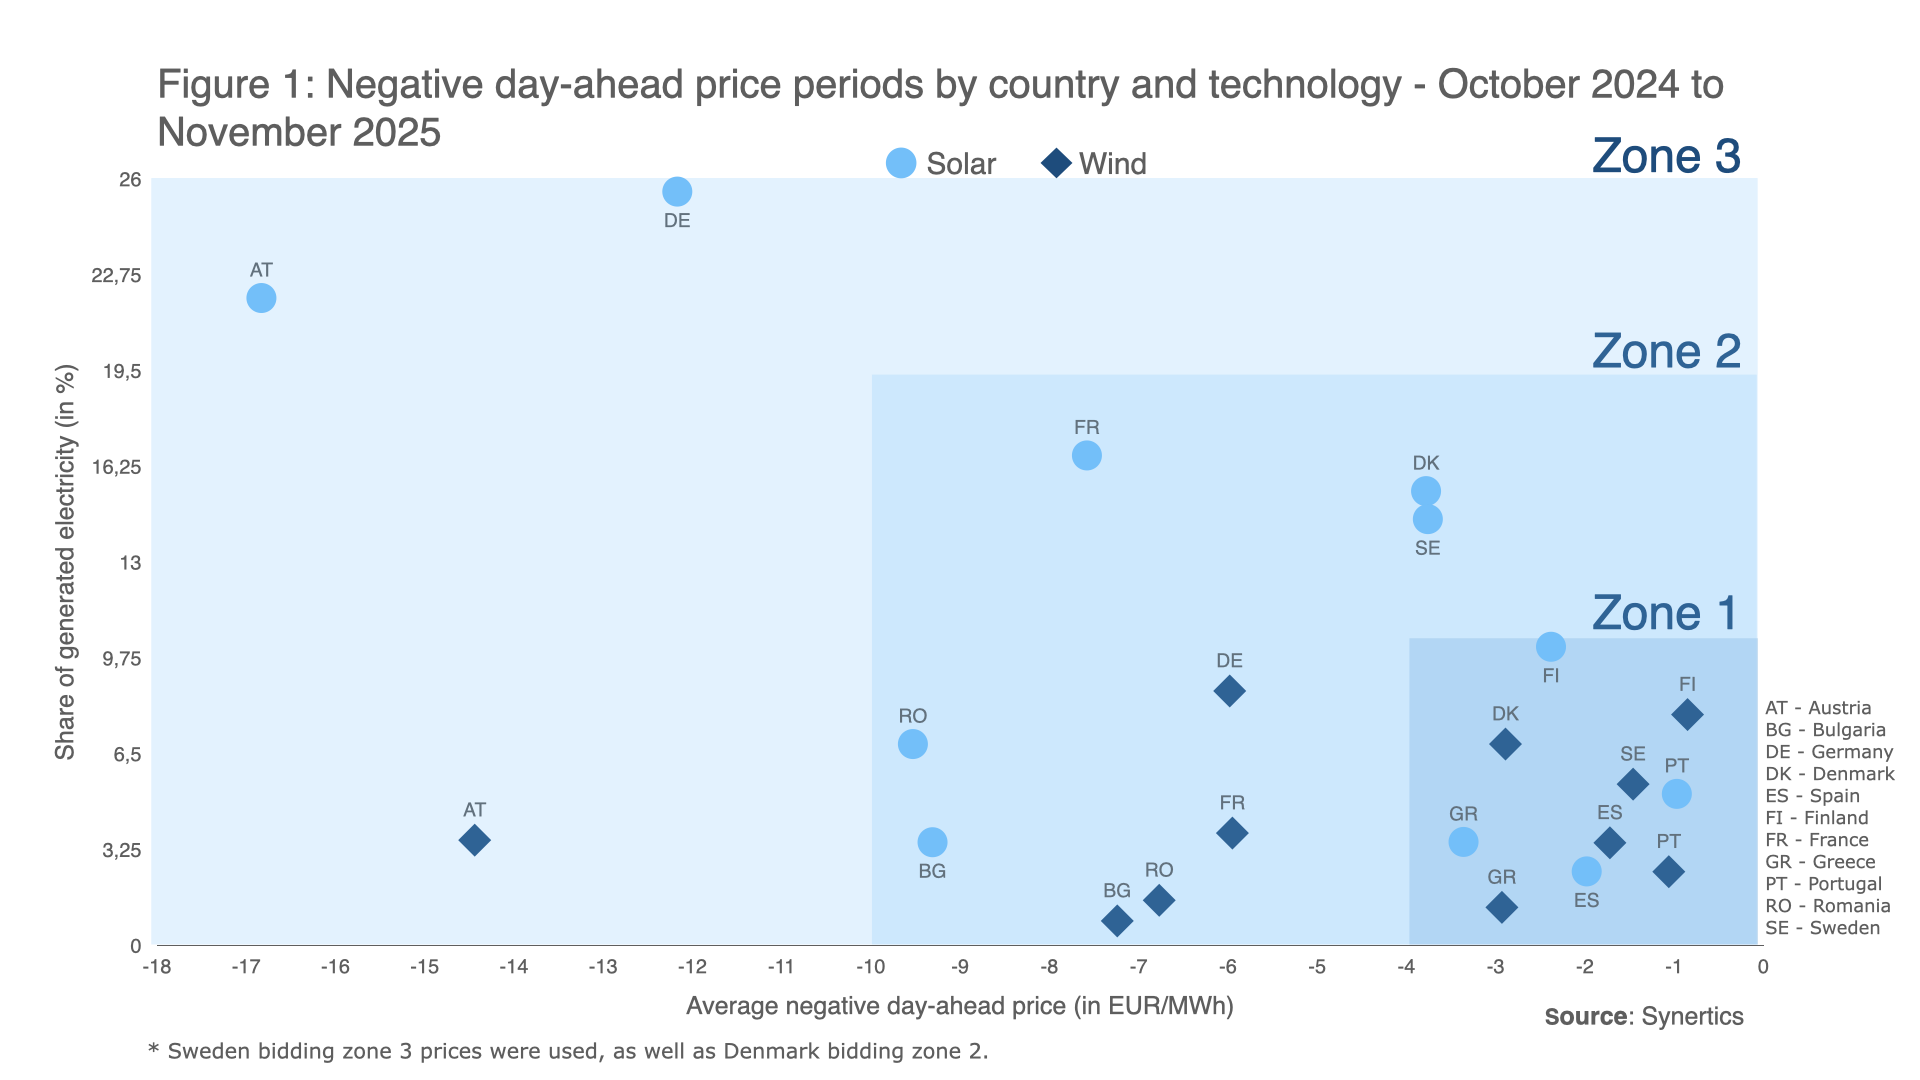
To support a more structured interpretation of the results, three zones were created, each reflecting different levels of exposure to the frequency and impact of day-ahead negative price periods.
In zone 1, it can be seen that negative prices have a low impact on renewable assets, with a range of up to 10% of the energy exposed to these situations and a range from 0 to -4 €/MWh of average negative price. This zone is mainly composed of Nordic countries, as these have relatively smaller capacities of solar energy, which leads to lower probabilities of occurrences of negative prices. As this region relies more heavily on wind generation, covering a big part of the consumption of these countries, prices in general are the lowest in Europe, leading also to small negative prices. In Southern European countries, excellent meteorological conditions ensure high and constant solar/wind generation across the 12-month study period. Consequently, the sheer volume of energy produced when prices are positive far outweighs the smaller amount affected by negative price events, leading to a lesser overall impact leading to small exposure to this events.
Although the countries in Zone 2 have a comparable or slightly lower share of energy exposed to negative prices than Zone 1, the prices themselves are significantly lower (more negative), reaching average negative prices for these countries are almost double, between -4 and -10 €/MWh. This zone is mainly represented by countries where solar power generation heavily influences the market, leading to solar assets being more affected, as expected. This deep pricing is acutely felt in countries like Romania and Bulgaria (Southeast Europe), where limited grid infrastructure creates extreme market volatility and leads to exceptional negative prices, sometimes reaching -7 to -10 €/MWh, despite the low exposure share. Other countries in Zone 2 face challenges primarily due to the rapid integration of solar capacity. The combination of high renewable supply and grid inflexibility drives these significant negative pricing events, which, as is typical elsewhere, affect solar assets more severely than wind.
In the most extreme cases, where PPAs in these regions have more exposure to negative prices events, we identify Zone 3. Austria is part of this extreme due to limited transmission infrastructure and grid congestion. The congestion and lack of transmission capacity often cannot handle the sudden, massive influx of power from the North (Germany) on top of Austria's generation mix of hydropower, wind, and solar output. While Austria relies heavily on hydropower, this capacity cannot always be ramped down immediately during surplus events. As the surplus cannot be moved or exported, it becomes trapped, forcing the local market price to plummet to these extreme negative levels. Germany faces similar challenges, where the rapid integration of solar power into the market directly leads to both transmission limitations and grid inflexibility.
To mitigate the impact of recurring negative-price hours, a range of measures are being implemented. One approach is the growing deployment of co-located PPAs, in which batteries mitigate intraday volatility and help absorb excess generation during solar-driven price dips. Increased participation of the producers in Ancillary Services further contribute to this risk mitigation, by using the exposed energy in negative prices hours in frequency regulation markets, thereby gaining financial benefits. Additionally, stronger cross-border interconnection capacity enables greater cross-border energy flows, smoothing price fluctuations by facilitating imports and exports. Together, these developments can contribute to reducing the occurrence of negative-price hours, ultimately improving the environment for closing a PPA.

 2 min
2 min

Projects
30th Jul, 2026
5 min

Insights, Market-trends, Announcements
30th Jul, 2026
4 min

Insights, Market-trends
12th Jun, 2026