Join us on our journey towards renewable energy excellence, where knowledge meets innovation.
The European wholesale electricity market has seen a rise in negative prices in several countries as they boost their production of renewable energy to meet sustainability goals.

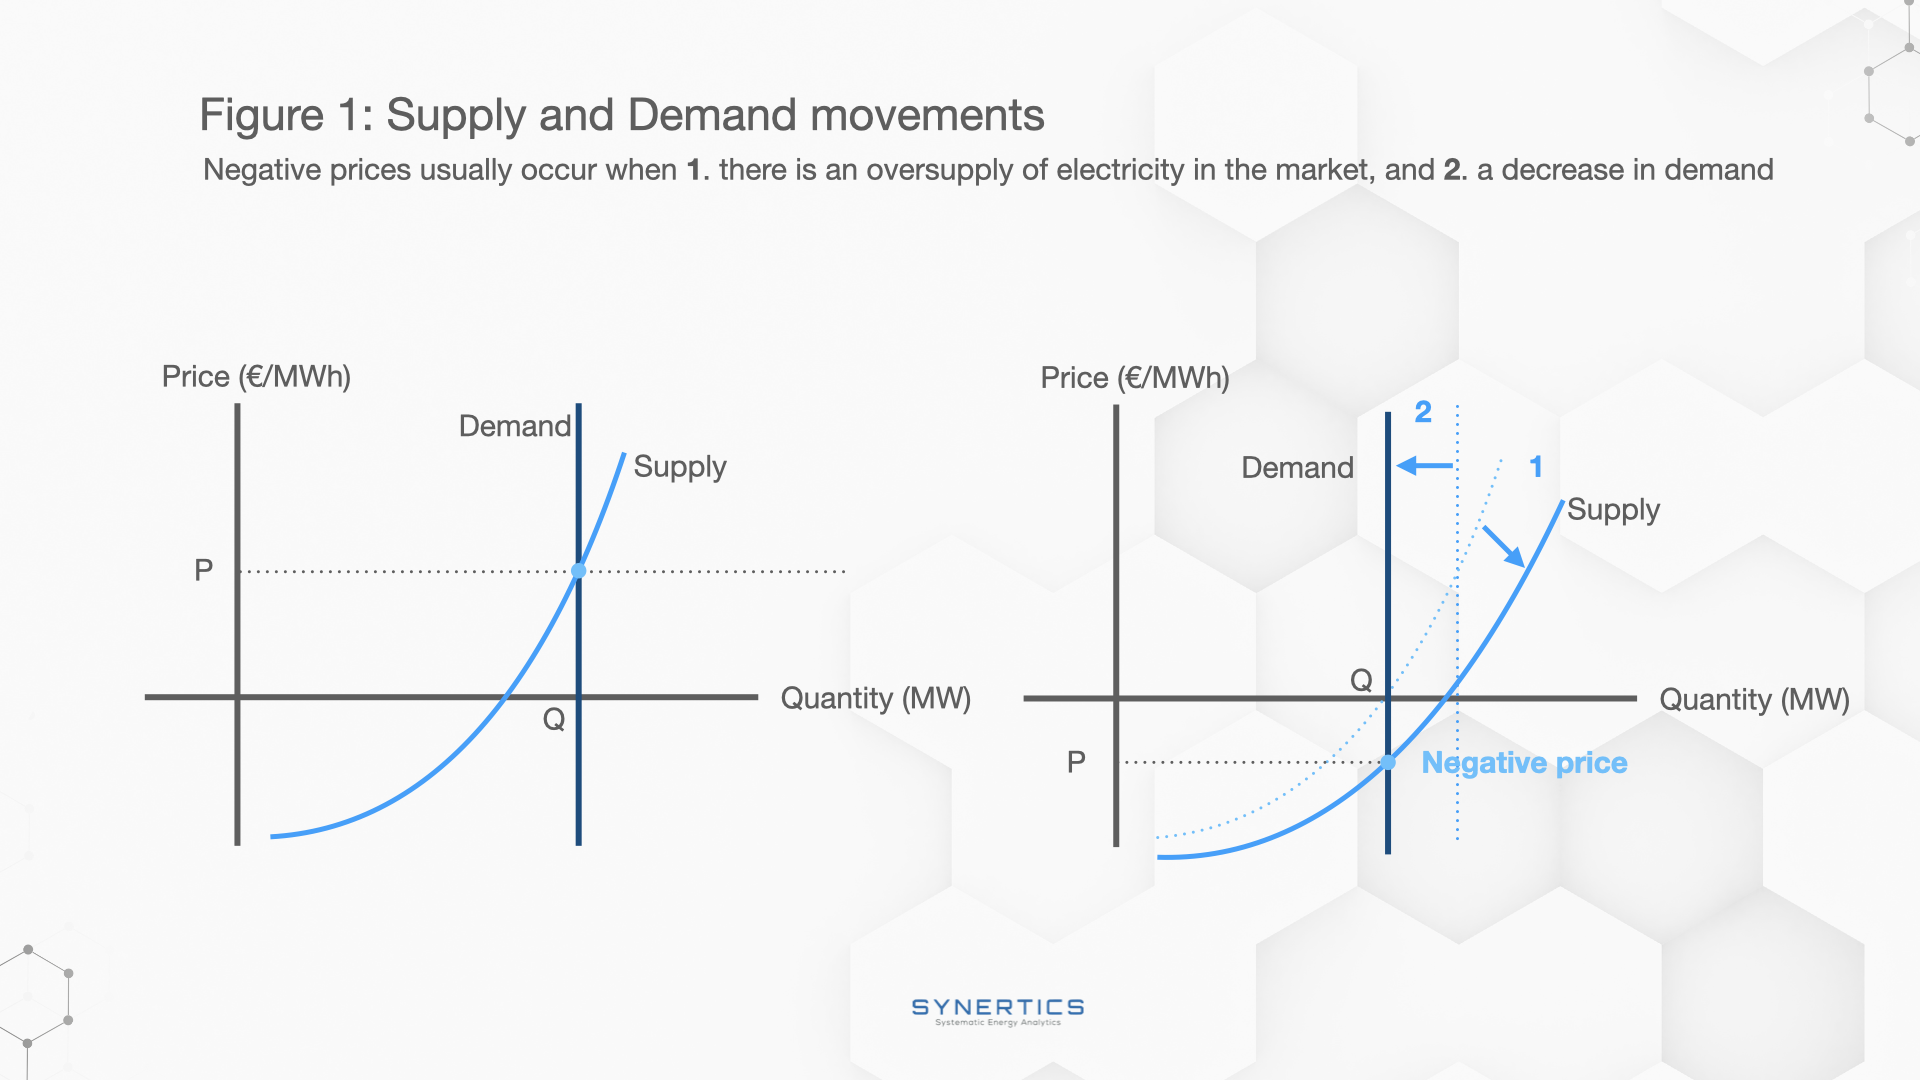
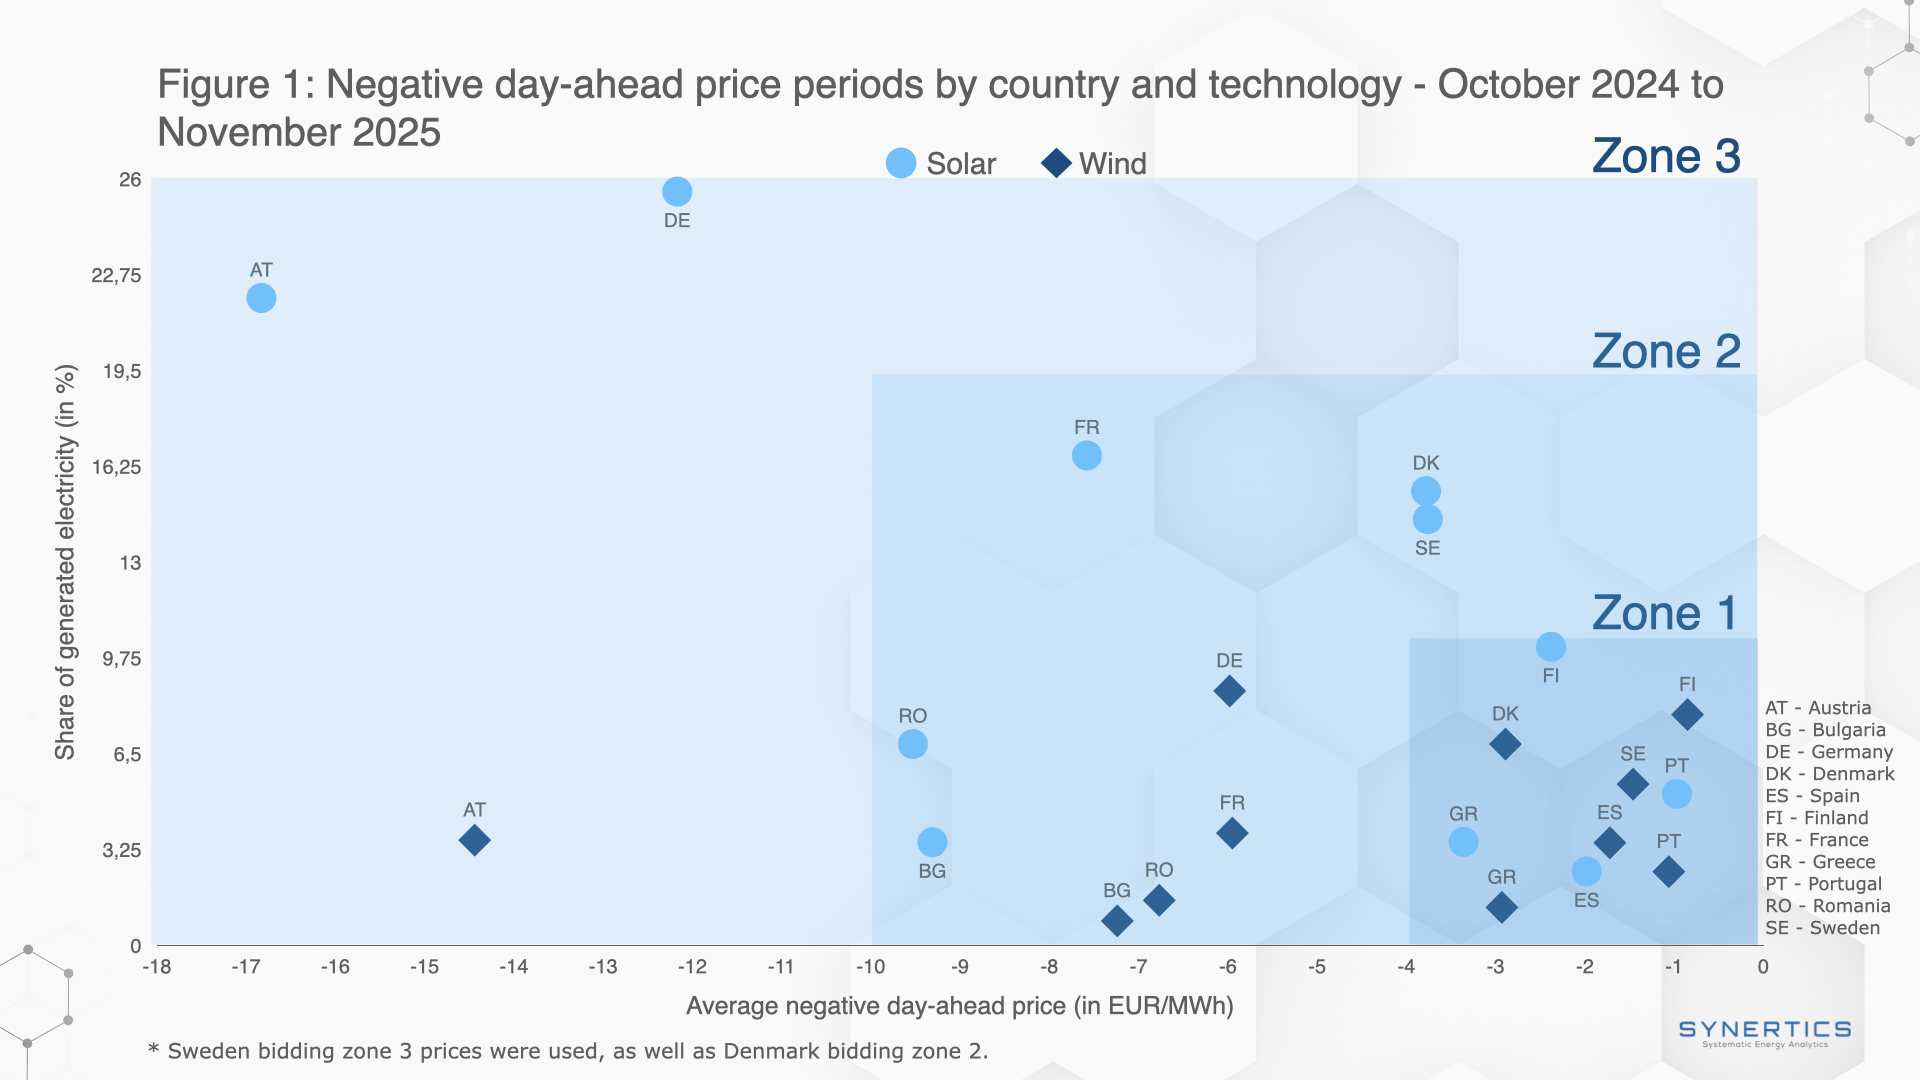
Negative prices occur when there's excess electricity due to oversupply and decreased demand (Figure 1). This can happen when renewable generation surpasses current demand and cannot be stored for later use. Generators offer negative prices to the wholesale market to ease the grid from surplus electricity and prevent potential overloads.
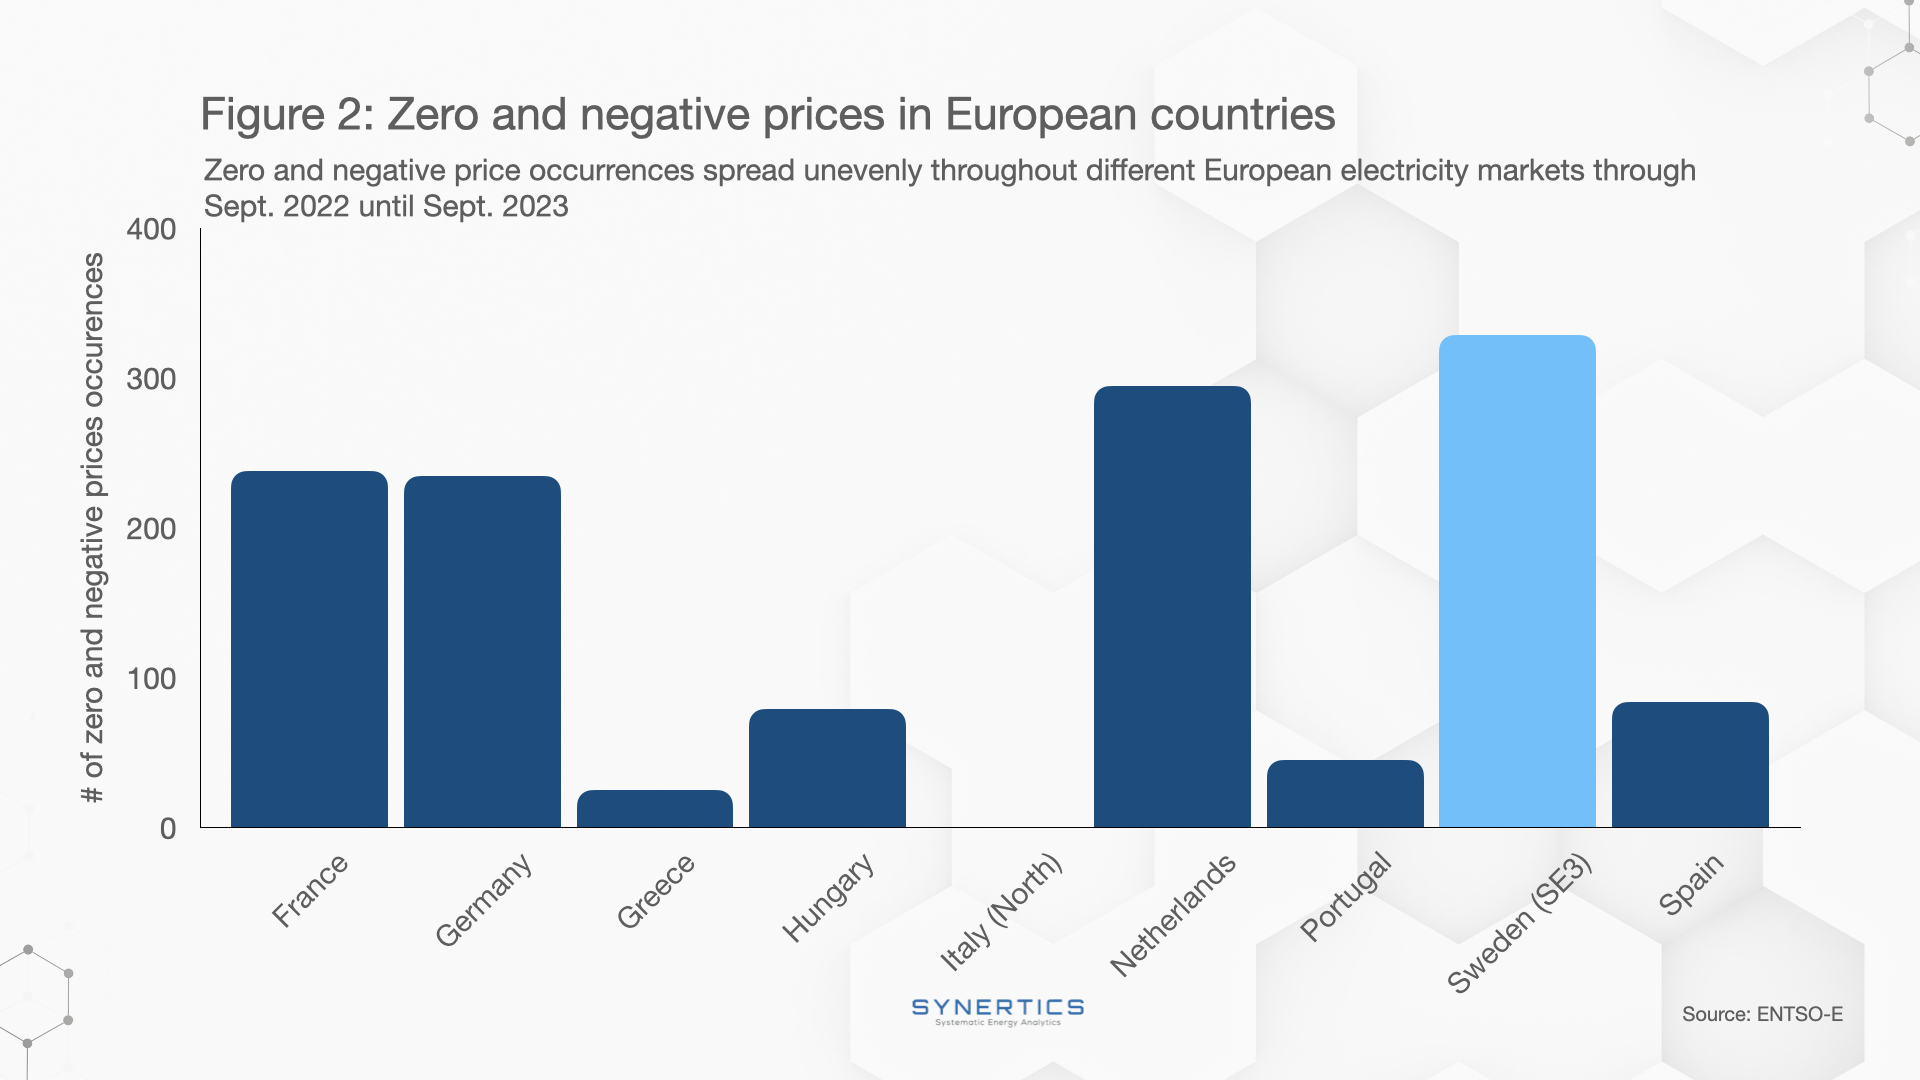
We aim to comprehend the dynamics of negative price occurrences in Europe by analyzing day-ahead price quotations over the past 12 months (June 2022 to June 2023) and understand which factors contribute to their impact on the market. This study will consider both negative and zero prices in its analysis.
- The Netherlands has topped the group with 295 occurrences.
- Greece registered only 25 occurrences.
Negative prices are influenced by various factors such as peaks in solar and wind energy production joined by a low electricity demand during such periods.
- On the 2nd of July 2023, Germany, Hungary, and the Netherlands featured an extremely low negative price (- 500€/MWh).
- Italy, Greece, Spain, and Portugal have only registered prices on the zero axis.
- The observed metrics tend to show minor variations on a general level.
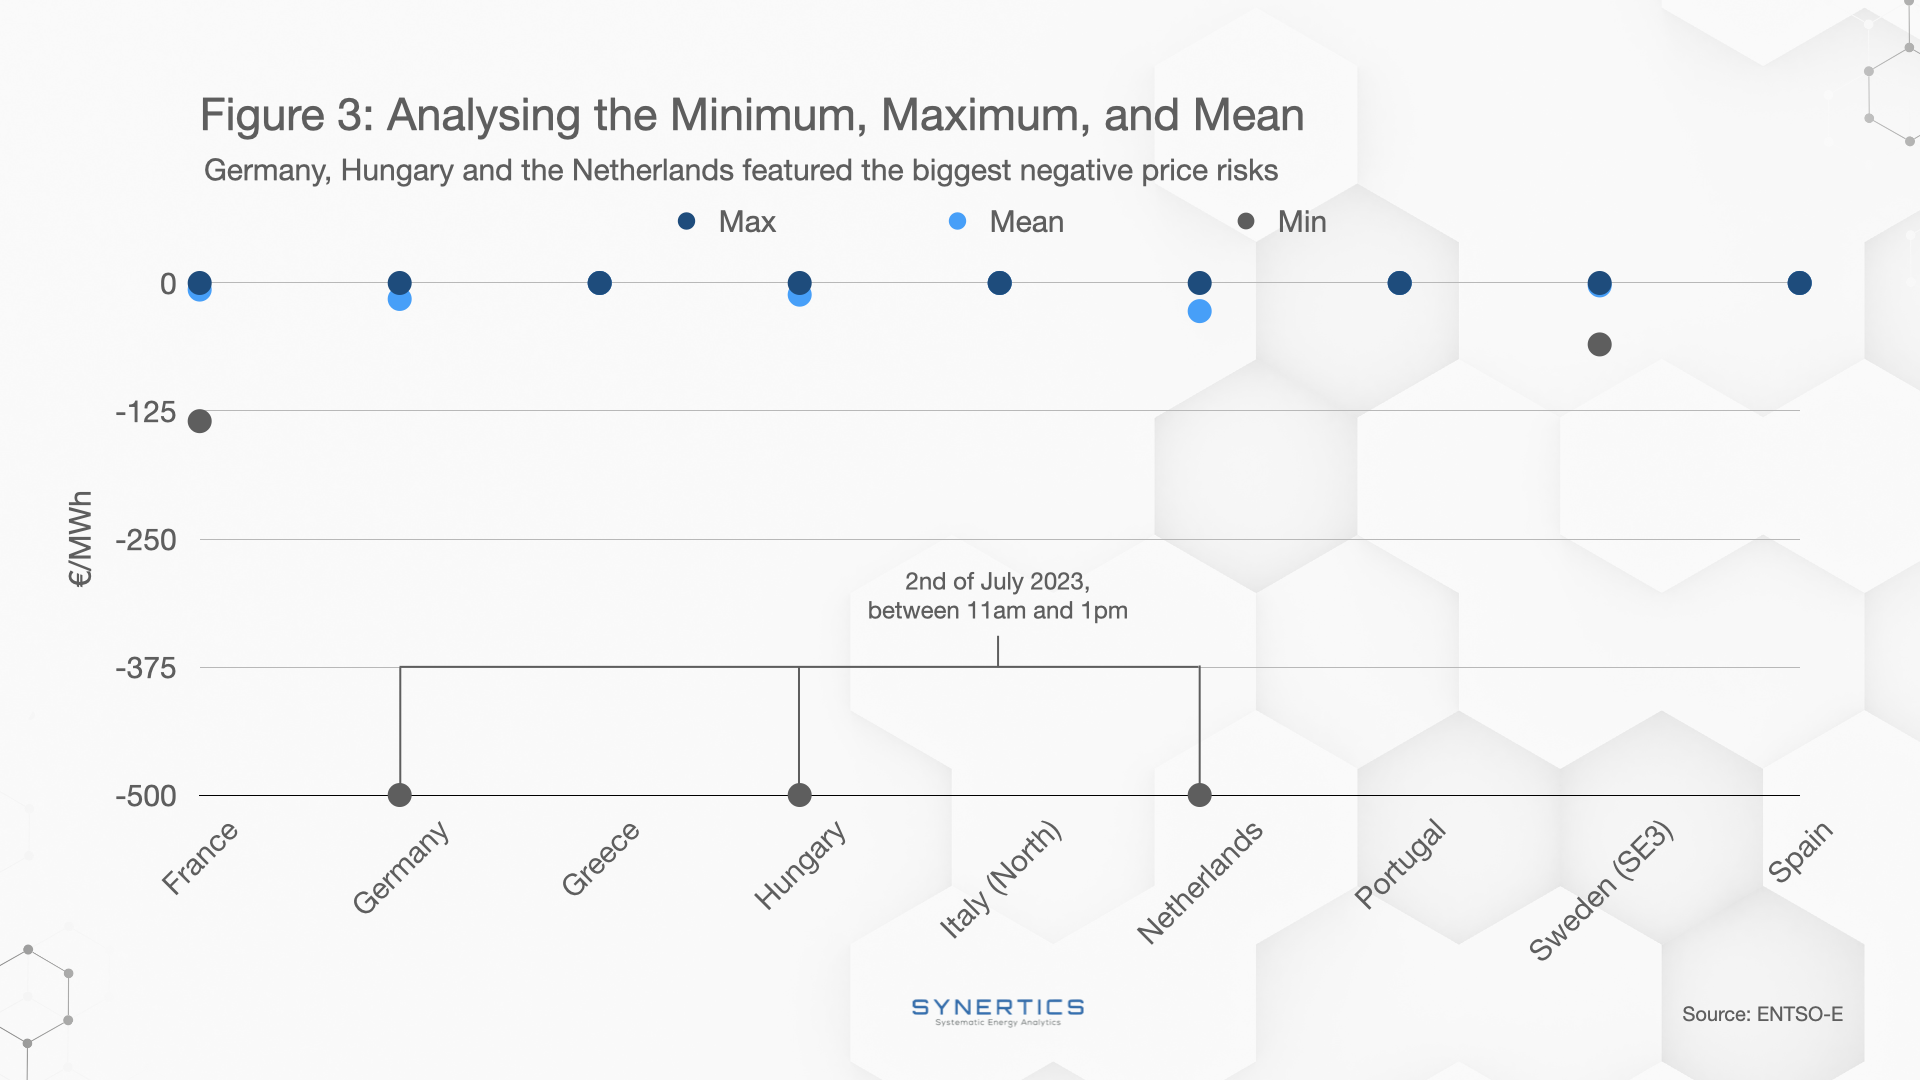
Apart from further research showing us that solar production in Germany, Hungary, and the Netherlands has been increasing from Sept. 2022 to Sept. 2023 (ENTSO-E), we noticed that the -500 €/MWh outlier happened on a Sunday, around noon.
How are negative price dips distributed through the days of the week and hours?
Figures 4 and 5 might provide the answer.
- Sunday registered the highest number of negative prices, with 530 occurrences.
- Weekends are more prone to negative price occurrences.
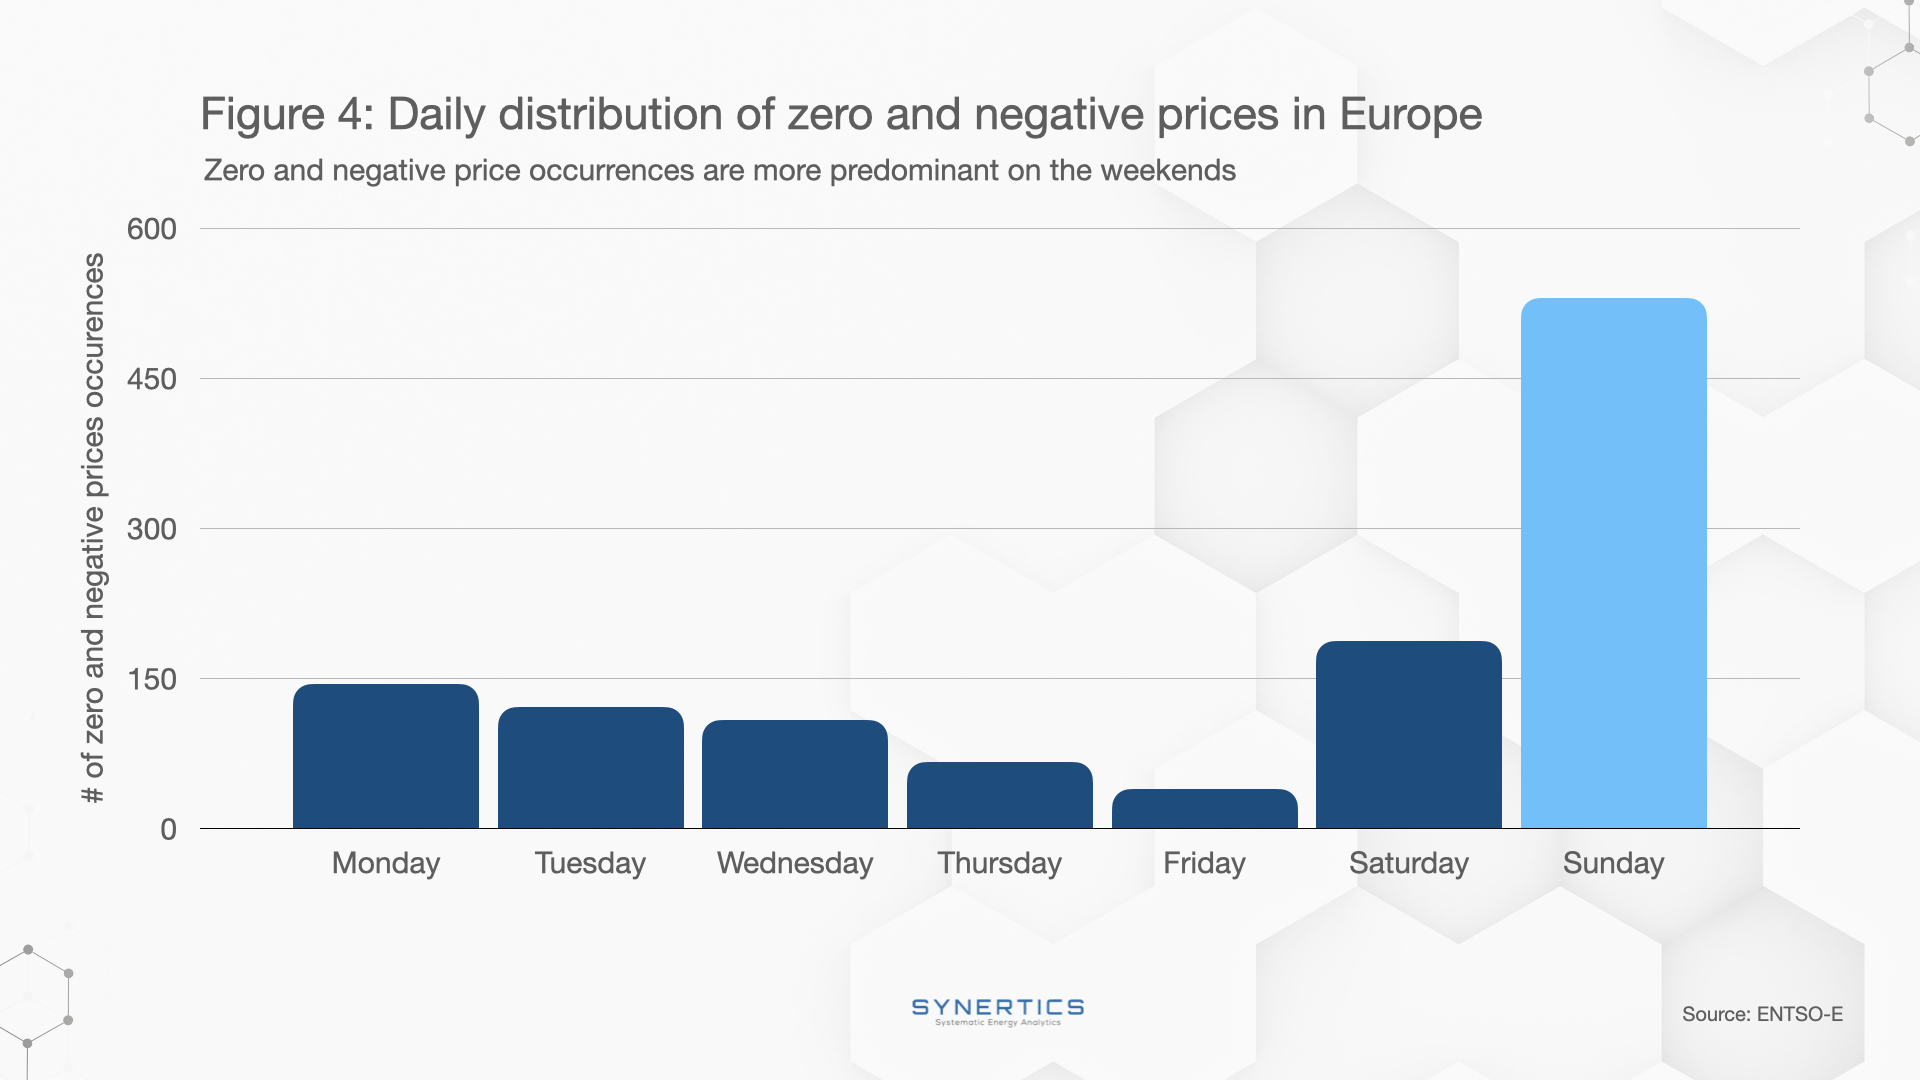
On weekends and holidays, reduced industrial production leads to decreased electricity demand and lower wholesale prices. Meanwhile, renewable energy generators continue producing electricity due to varying sunlight and wind patterns, resulting in an oversupply that further drives wholesale price reductions, occasionally reaching negative levels.
- Between Sept. 2022 and Sept. 2023, the peak of the solar profile curve coincides with the highest number of negative price occurrences, which happened at noon.
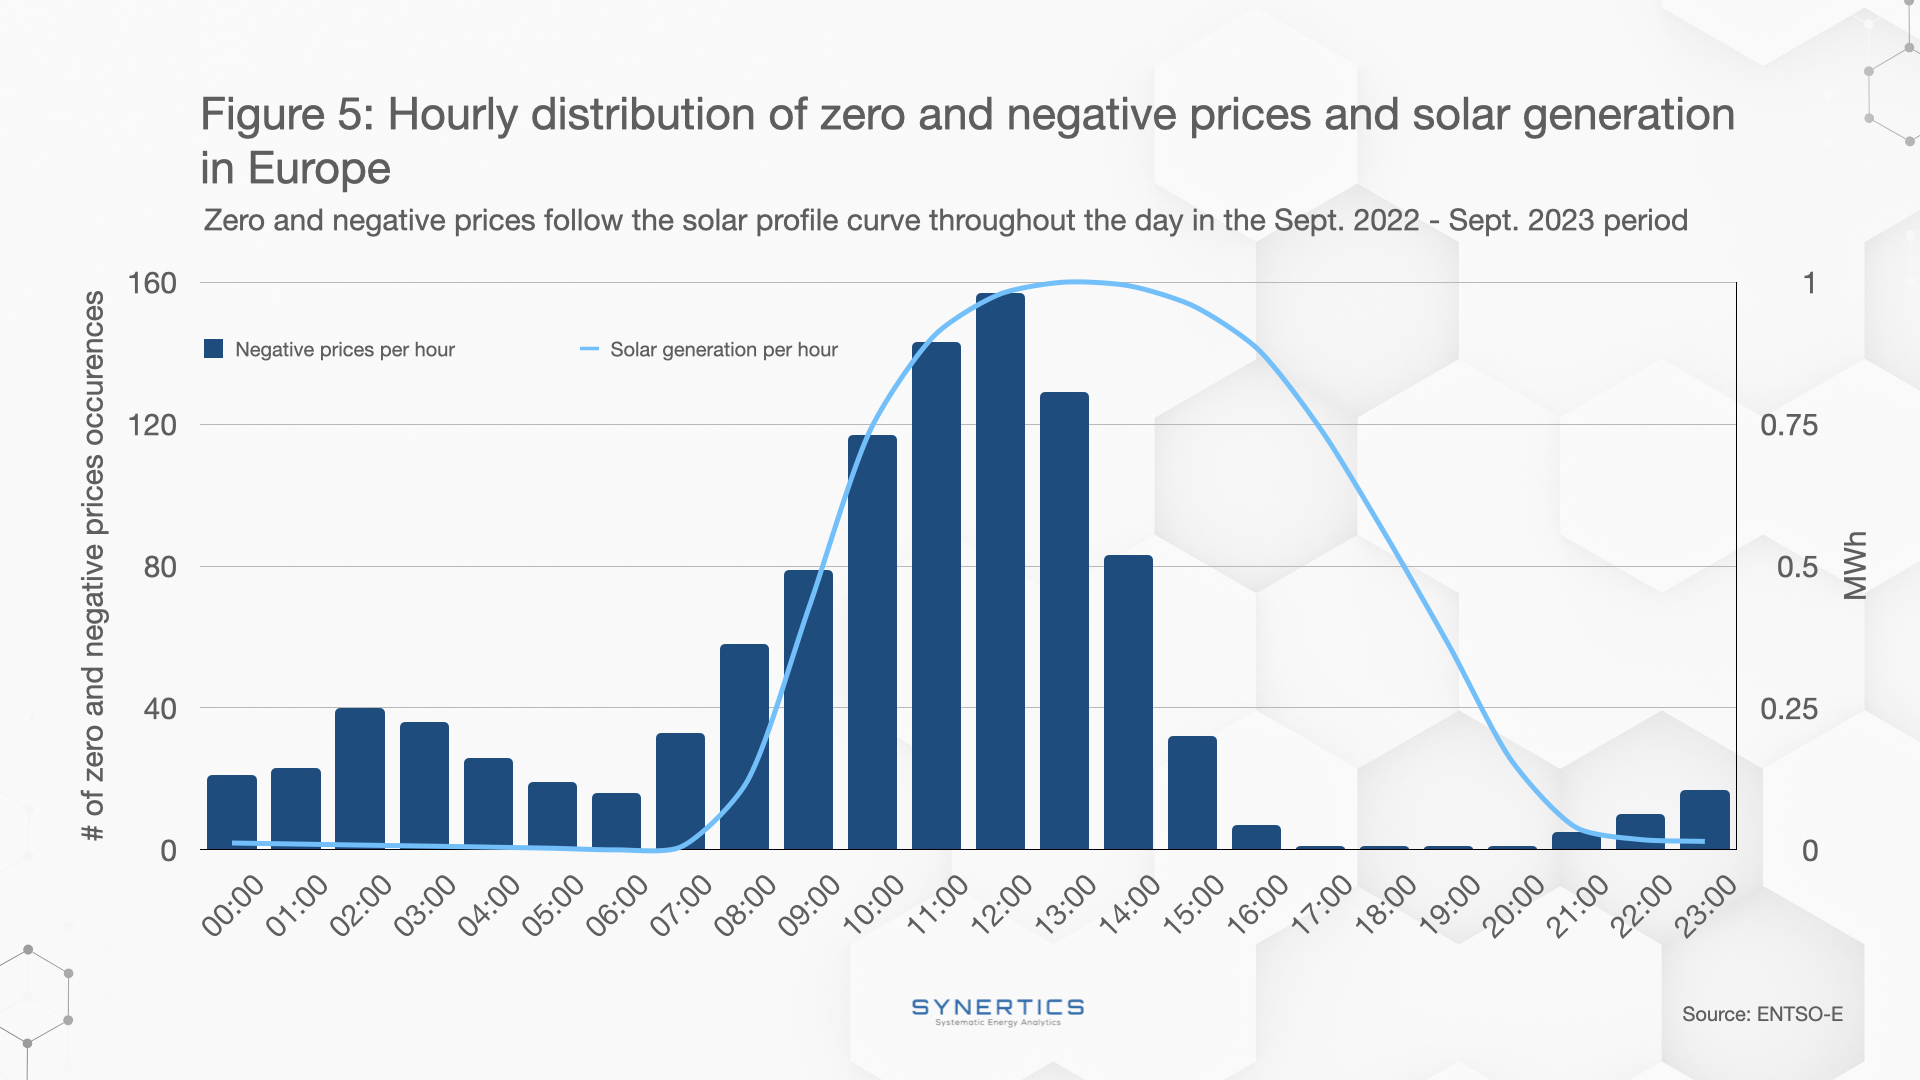
Given the established relationship between solar profile peaks and solar generation peaks, wholesale prices were expected to decrease during those periods.
Negative prices may serve as a strong motivation for generators to adopt real-time grid management systems that enable curtailment of generation, leading to both cost savings and revenue optimization. With the volatile nature of renewables at play, negative prices serve as a market indicator for the increasing importance of storage solutions to manage overproduction.
Synertics provides advisory services and develops digital data-driven solutions for the energy industry with the purpose of driving productivity and transferring knowledge.
Market-trends
6th Feb, 2026
Insights, Market-trends
15th Dec, 2025
Market-trends, Projects
27th Nov, 2025