
Join us on our journey towards renewable energy excellence, where knowledge meets innovation.

The struggle against climate change requires a worldwide effort to decarbonise economic activities. By 2030 the European Union aims that 42.5% of its energy consumption is generated by renewable sources. This pushes Member States to build additional renewable capacity, especially solar and wind.


Transitioning electricity generation towards a more sustainable mix, however, can impact the electricity day-ahead prices, possibly impacting a renewable asset’s market value. In this scenario of transition, what can we expect, in terms of solar PPA pricing in Europe, for the coming years?
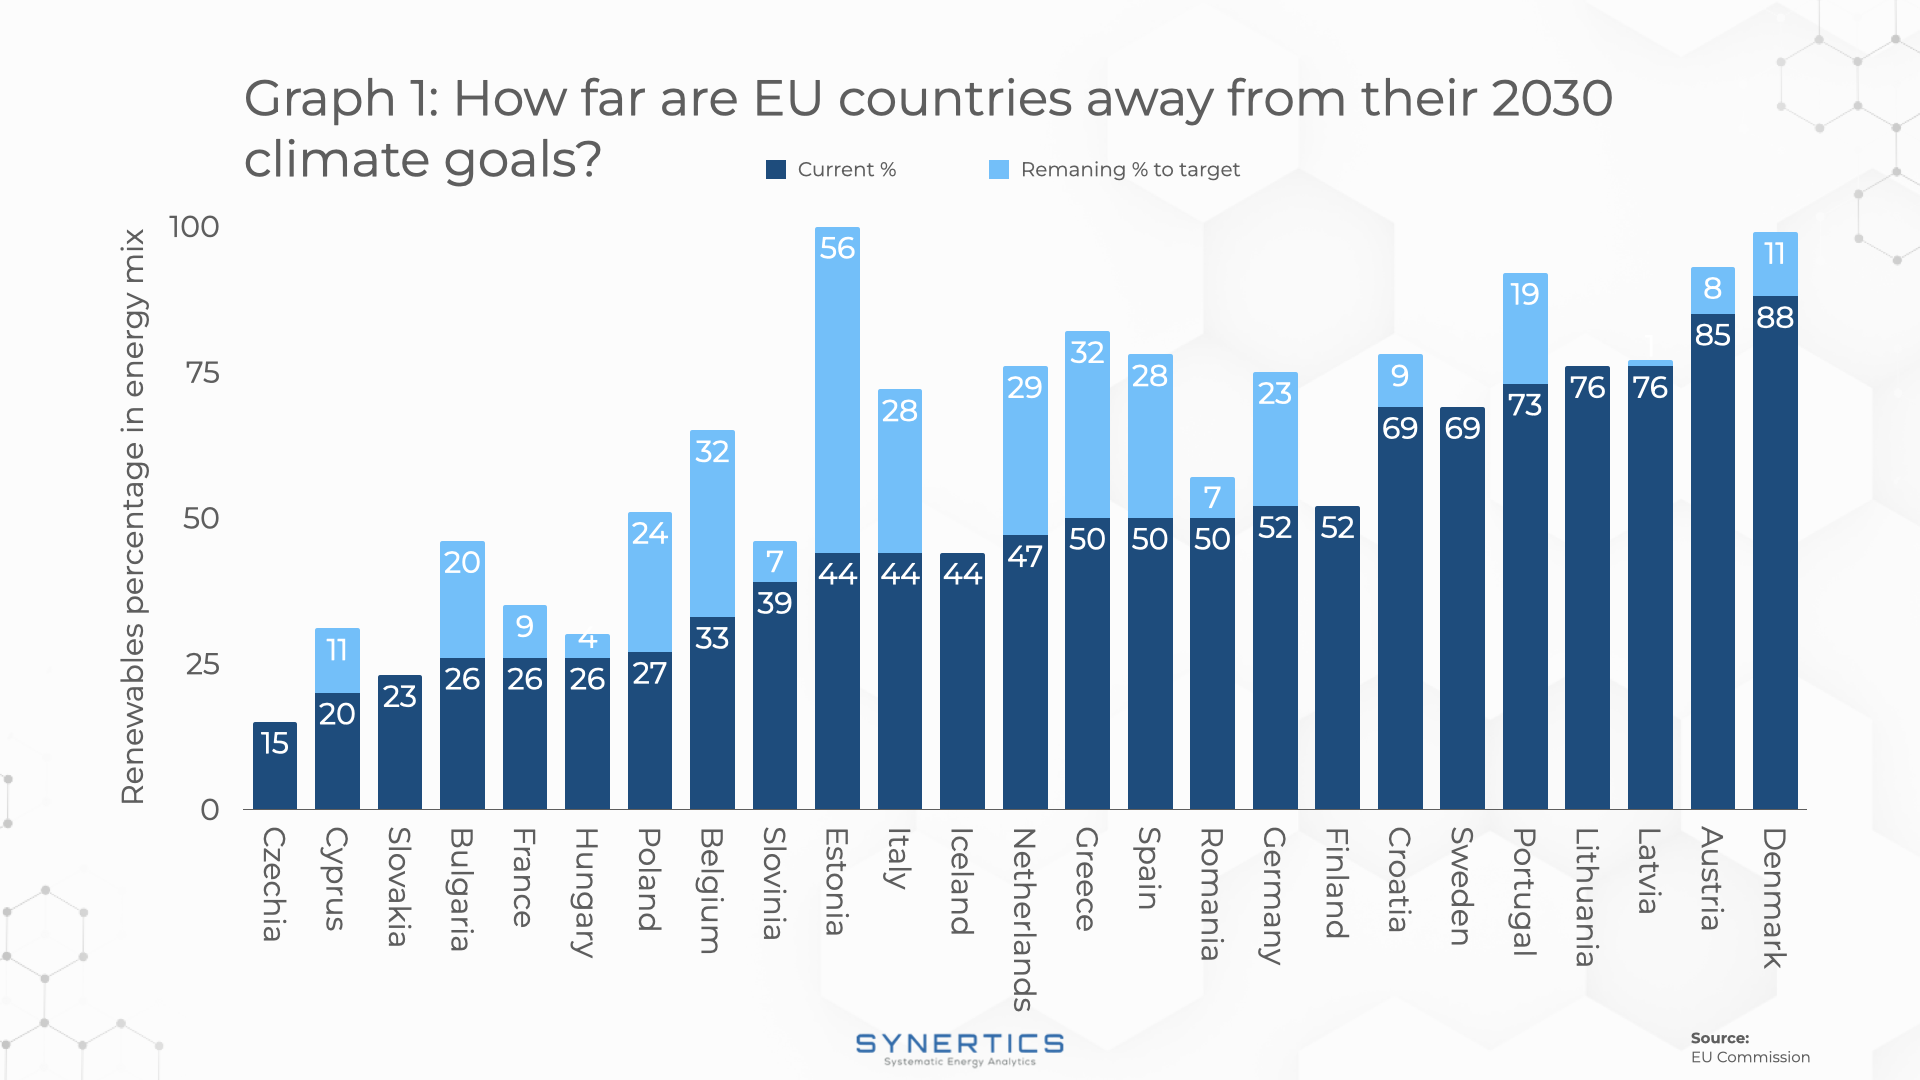
Graph 1 illustrates the current (2024) stage of EU countries towards their individually determined 2030 climate goals. This graphic focuses on the share of renewable production within the total energy mix of EU countries. Each country is represented by two bars: the dark blue bar indicates the current percentage of energy derived from renewable sources, while the light blue bar represents the gap remaining to reach their respective 2030 targets.
As top performers Denmark, Austria, and Latvia show a high current percentage of renewable energy generation, indicating significant progress, but still have gaps to fill to meet their goals.
On the other hand, countries such as Estonia and Poland are lagging further behind, with proportionally larger light blue bars indicating a substantial distance from their 2030 targets.
This visual representation shows the varying levels of progress across the EU in regards to increased efforts and policy measures, with respect to renewable energy production, to meet the 2030 climate objectives.
Despite the differences in targets and paths still needed to reach them, the installed capacity of solar PV assets is expected to grow in the next few years, as has been happening in most European countries. At the same time, the hourly profile of the day-ahead prices have also changed.
To illustrate this, Graphs 2, 3 and 4 present the hourly profile of the day-ahead price for each year since 2020. Cases study examples of Germany, Poland and Bulgaria are shown here.
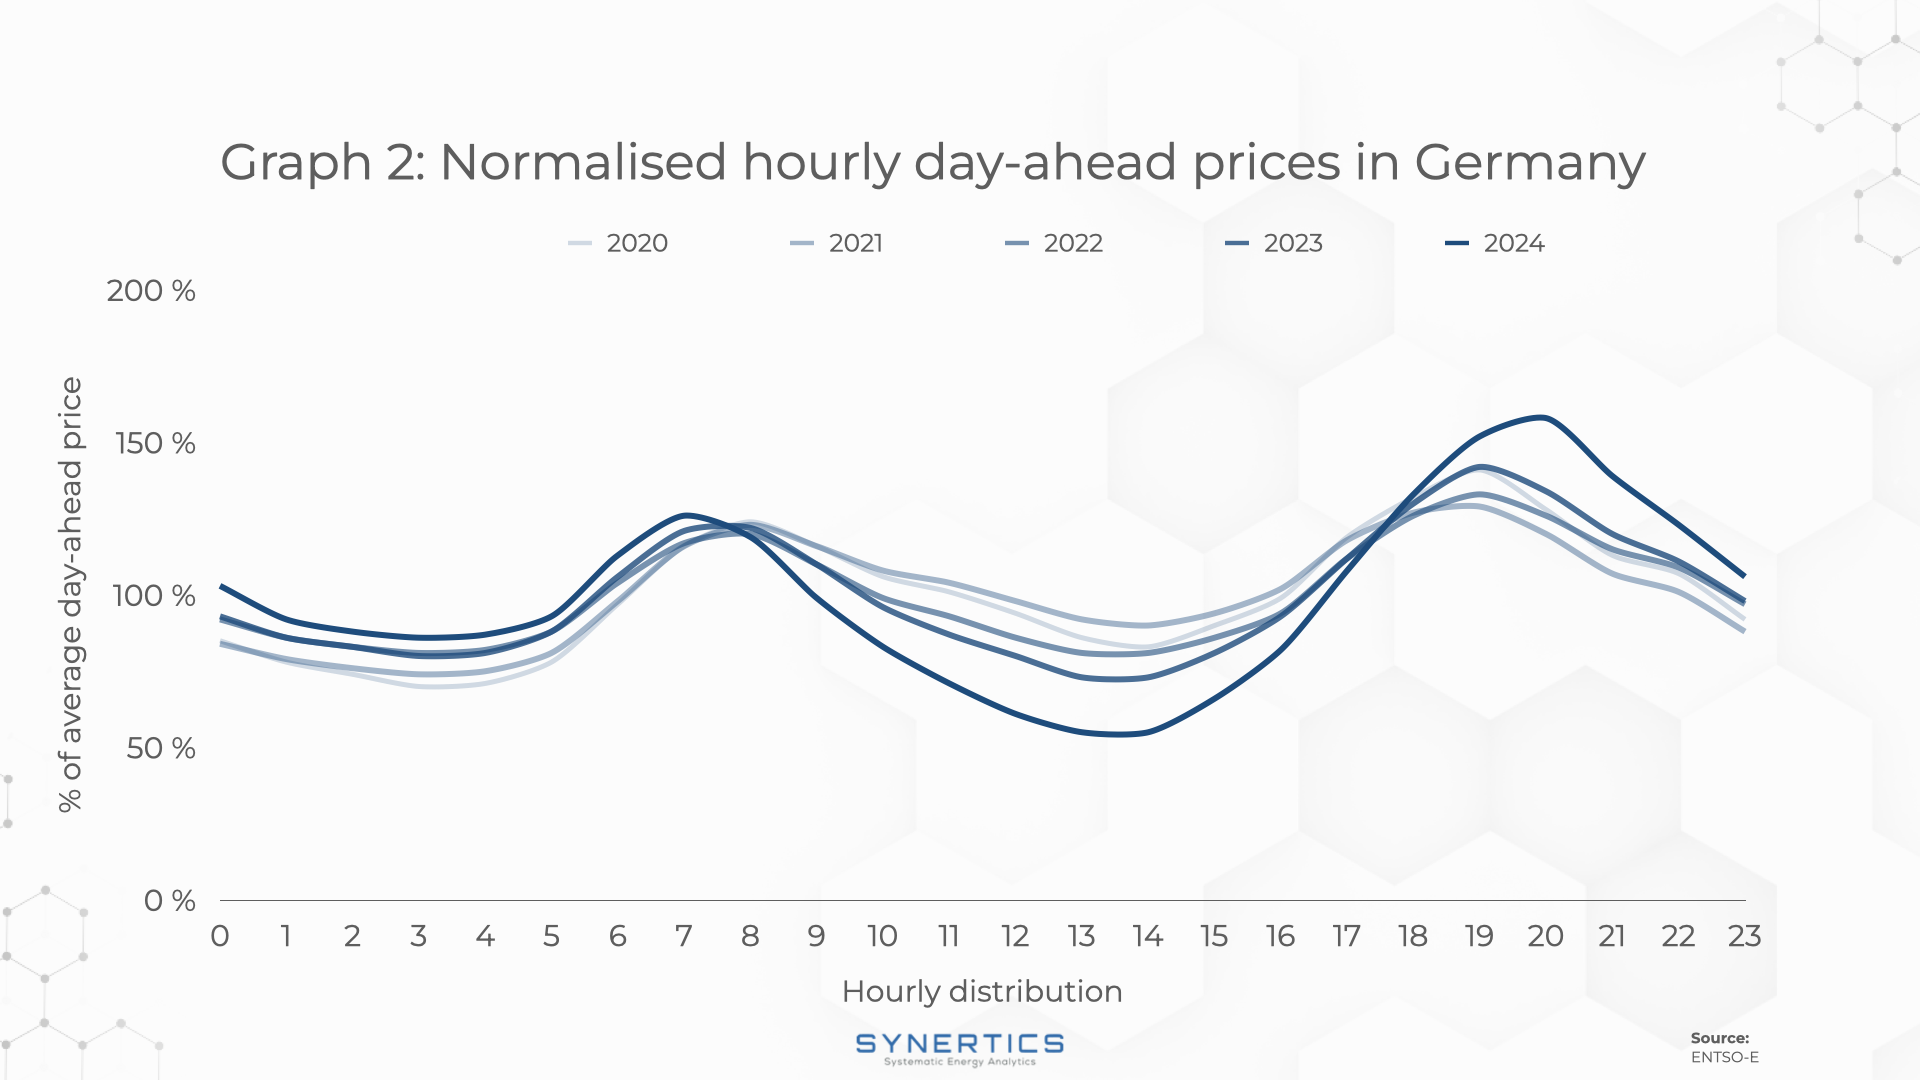
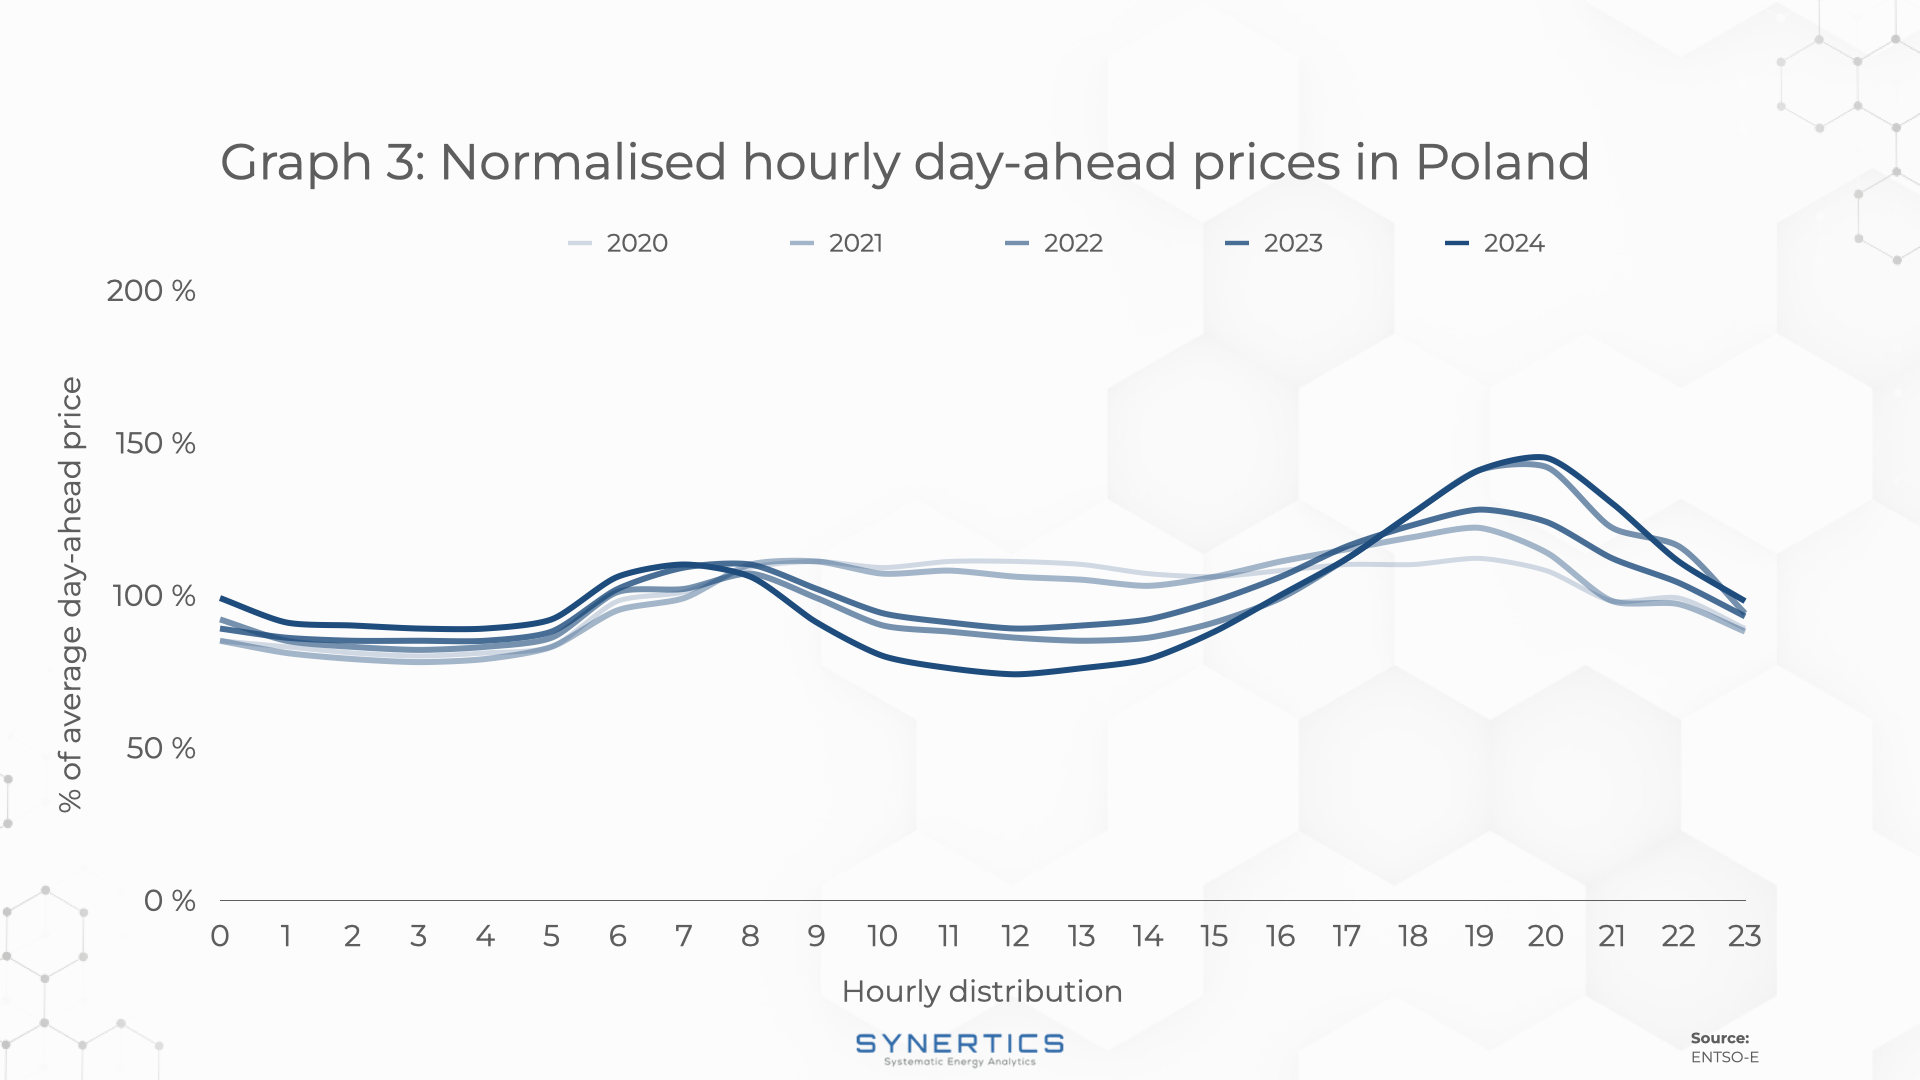
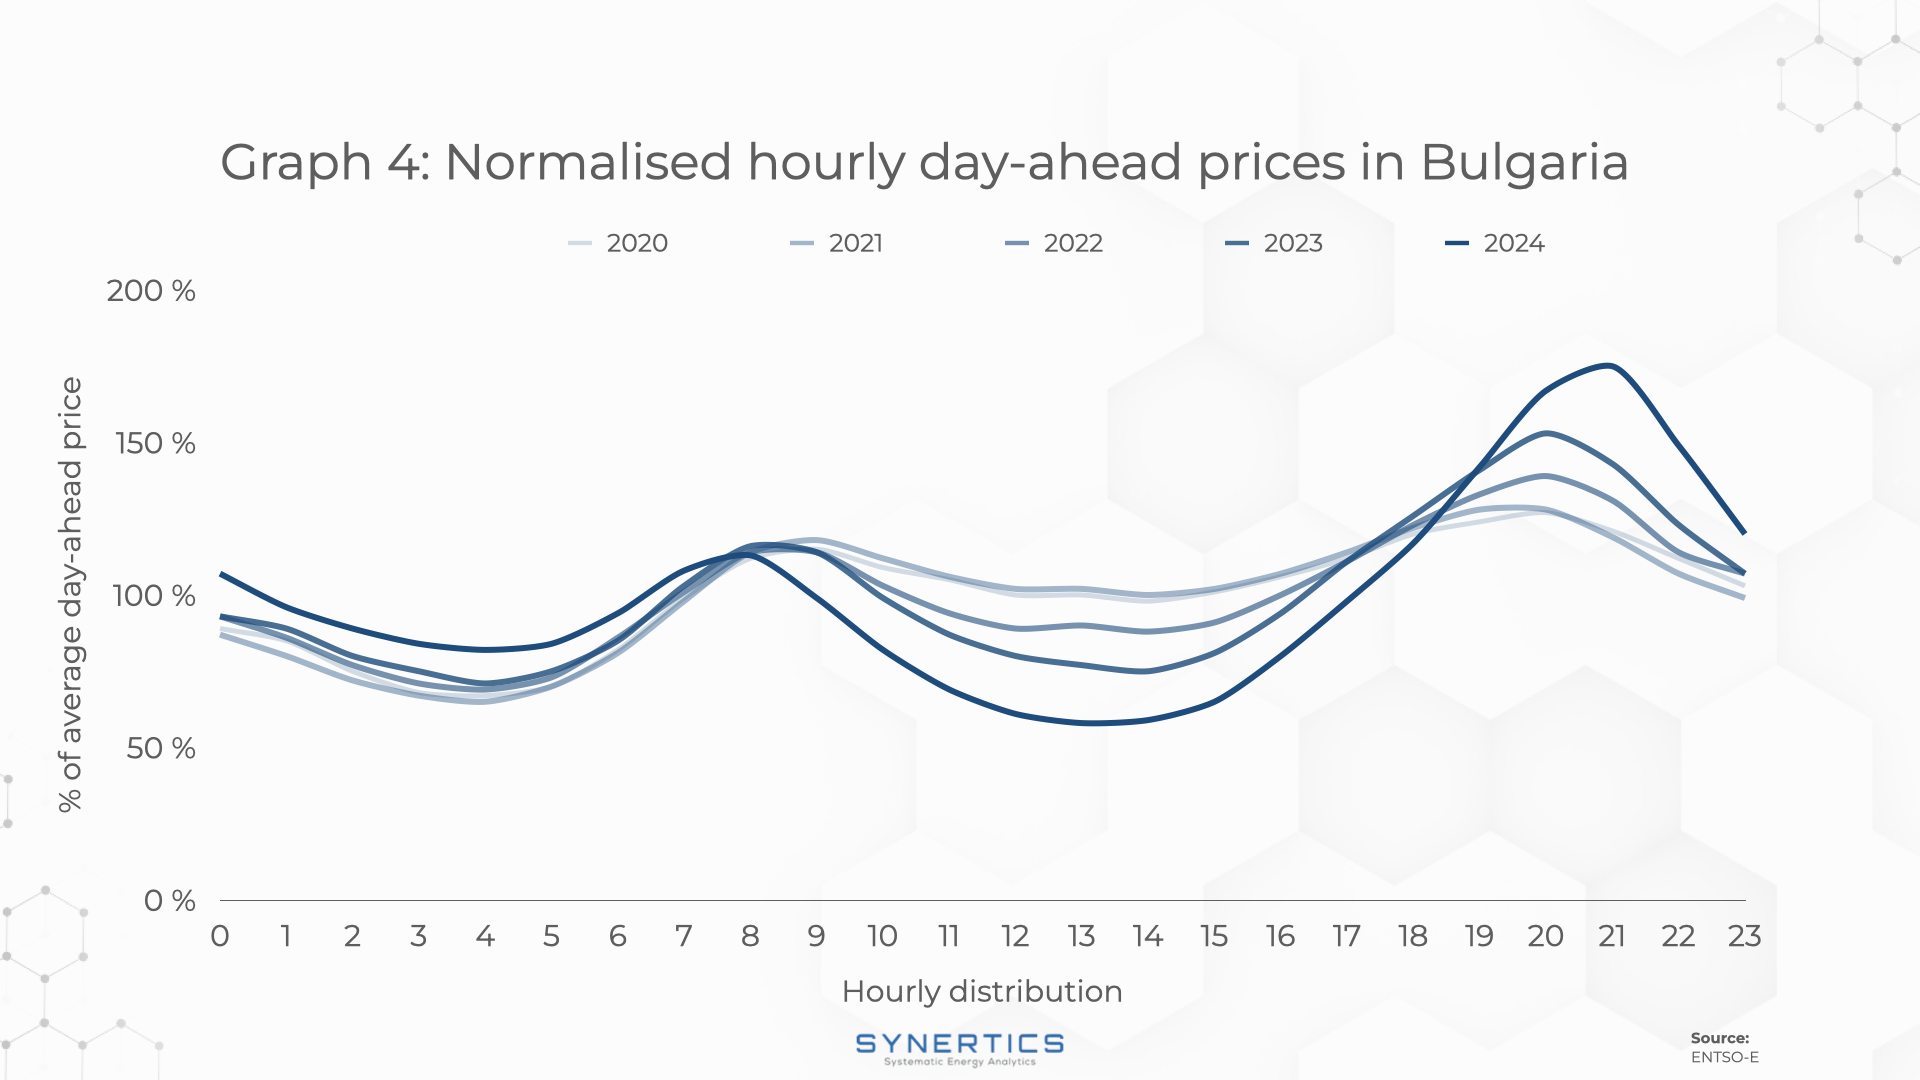
Each line represents the normalised day-ahead price (average hourly price divided by average yearly price) during the respective year.
As observed, each year the curve reaches a new, lower minimum point during sunlight hours, making a duck-curve shape even more pronounced. This phenomenon can be attributed to the cannibalisation effect which occurs when renewables of the same generation profile (in this case, solar PV) generate simultaneously, lowering the day-ahead electricity price. Furthermore, the occurrence of negative prices also intensifies as a result of such increased capacity, lowering the capture price for renewables even more. The impact this phenomenon can have on the PPA pricing, especially for solar assets, is far from negligible.
Many other factors influence the electricity day-ahead prices and thus the PPA prices: Total demand, natural gas prices, the prices of Guarantees of Origins and more. However, in a scenario where all these factors remain constant, PPA pricing for PV assets could lower, harming the return on investments.
As demonstrated clearly in the graphics above, the characteristic duck curve shape has become increasingly pronounced over the past years. With continued investment pouring into solar assets this trend is likely to intensify, unless regulatory changes, or other factors such as natural gas supply disruptions affect the overall market.
The ongoing pursuit to meet climate targets is bringing some drawbacks for the supply of renewable energy, particularly solar, as its profitability might be in decline: As we get closer to reaching these targets, the lower prices for energy resulting from these investments in solar technology reduce the attractiveness of further investments in renewable energy sources as prices are so low.
This dynamic ultimately hinders progress and becomes a self-defeating cycle. PPAs for wind technology may become more attractive as a result of this, as a way for investors and developers to avoid the midday price lows. Additionally, storage solutions are likely to play a more vital role in further solar development as a way to avoid low prices, and allow stakeholders to capitalise on the higher morning and evening price surges.

 5 min
5 min

Insights, Market-trends, Announcements
30th Jul, 2026
4 min

Insights, Market-trends
12th Jun, 2026
8 min
Insights, Market-trends
11th Jun, 2026